Open Access
Fig. 6.
Download original image
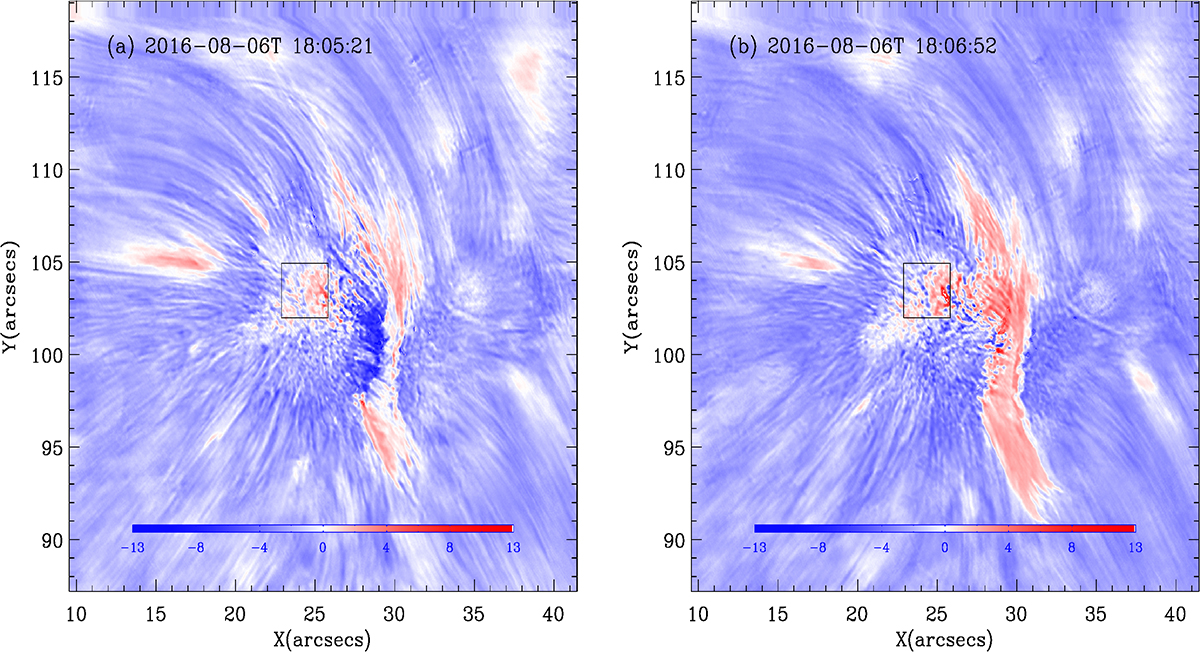
LOS Doppler velocity maps obtained from GST/VIS. The black box shows the subtracted reference region. The two moments represent different patterns in eruption and fallback of intermittent jets.
Current usage metrics show cumulative count of Article Views (full-text article views including HTML views, PDF and ePub downloads, according to the available data) and Abstracts Views on Vision4Press platform.
Data correspond to usage on the plateform after 2015. The current usage metrics is available 48-96 hours after online publication and is updated daily on week days.
Initial download of the metrics may take a while.