Fig. 4.
Download original image
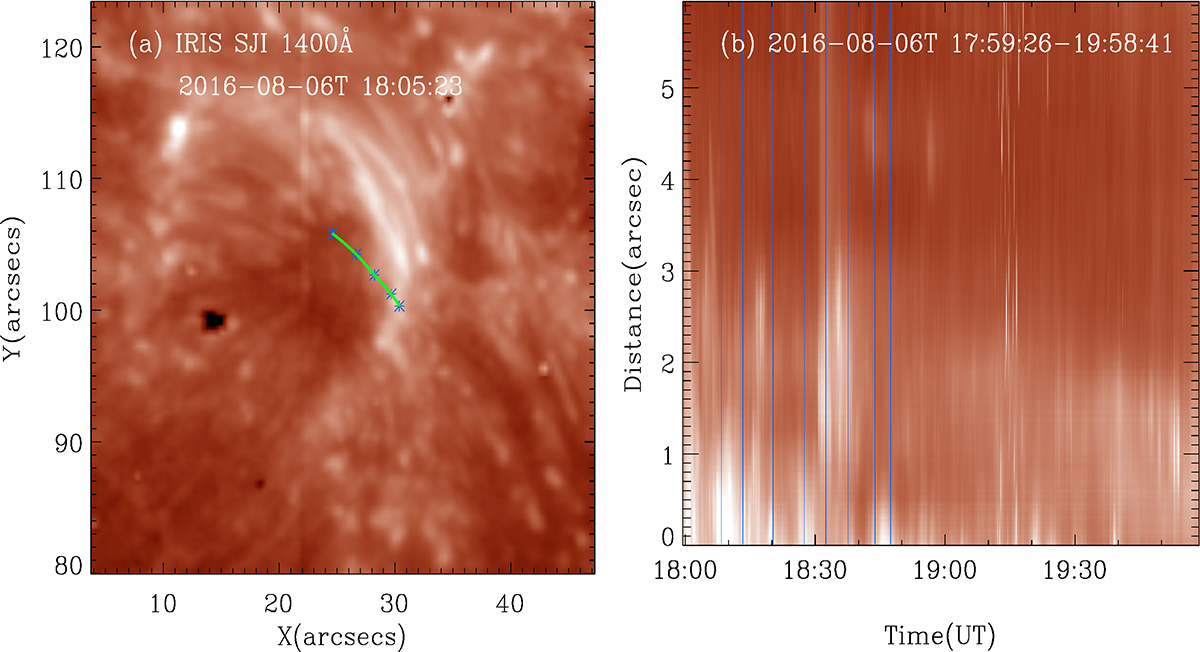
Oscillation behavior shown in the time-slice diagram of the evolution of the intensity at the jet base. Panel a: IRIS SJI 1400 Å image. The green curve indicates the location of the slit for the time-slice diagram. Panel b: Time-slice diagram along the slit. The vertical blue lines were used to mark the moments of clear brightening.
Current usage metrics show cumulative count of Article Views (full-text article views including HTML views, PDF and ePub downloads, according to the available data) and Abstracts Views on Vision4Press platform.
Data correspond to usage on the plateform after 2015. The current usage metrics is available 48-96 hours after online publication and is updated daily on week days.
Initial download of the metrics may take a while.