Open Access
Fig. 3.
Download original image
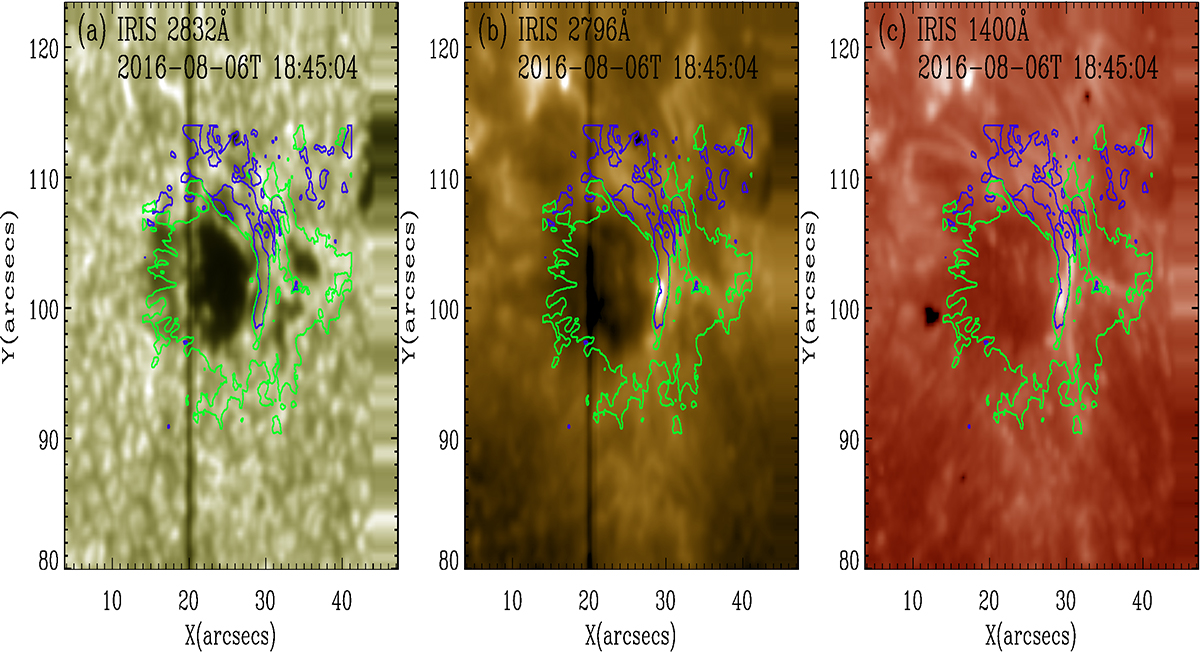
Images of SJI 2832 Å, 2796 Å, and 1400 Å superimposed with BBSO/NIRIS longitudinal field data. The blue and green lines represent the longitudinal magnetic field boundary contours of +30 and –200 G, respectively.
Current usage metrics show cumulative count of Article Views (full-text article views including HTML views, PDF and ePub downloads, according to the available data) and Abstracts Views on Vision4Press platform.
Data correspond to usage on the plateform after 2015. The current usage metrics is available 48-96 hours after online publication and is updated daily on week days.
Initial download of the metrics may take a while.