Open Access
Fig. 2.
Download original image
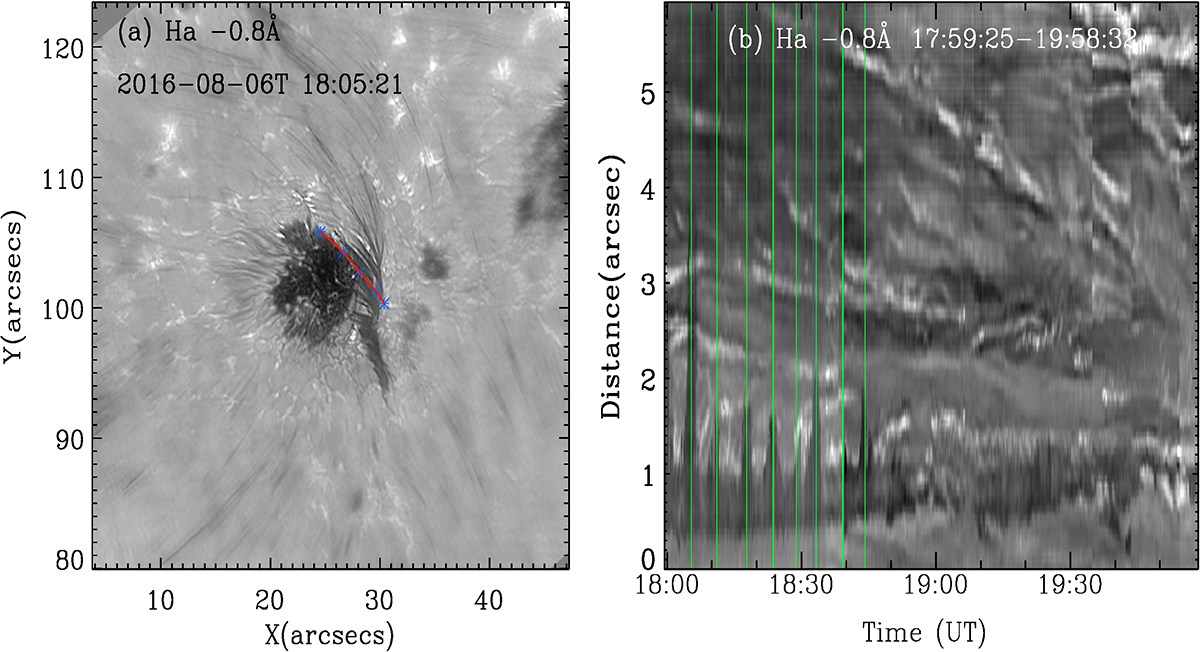
Oscillation behavior shown in the time-slice diagrams in S1 (red curve) marked in the Hα blue-wing image at –0.8 Å (left panel). The right panels show the plasma trajectories moving along S1. S1 represents the motion path of the intermittent jet.
Current usage metrics show cumulative count of Article Views (full-text article views including HTML views, PDF and ePub downloads, according to the available data) and Abstracts Views on Vision4Press platform.
Data correspond to usage on the plateform after 2015. The current usage metrics is available 48-96 hours after online publication and is updated daily on week days.
Initial download of the metrics may take a while.