Fig. 13.
Download original image
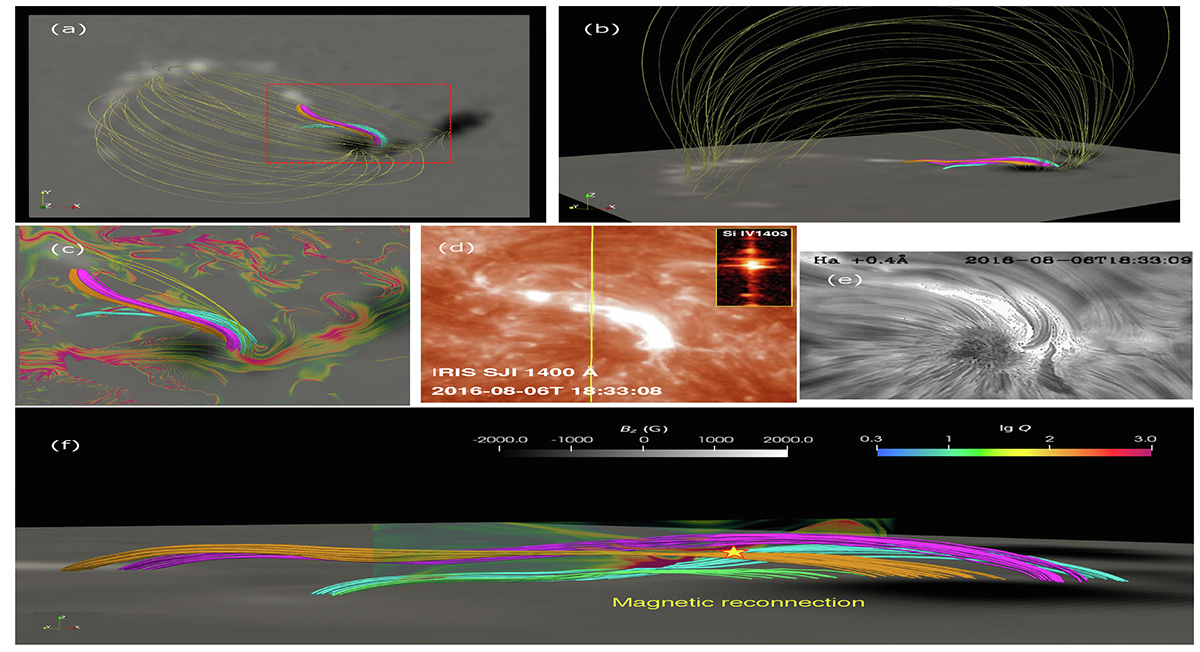
3D magnetic configuration constructed with the NLFFF model. Panels a and b exhibit the top and side views of a few typical field lines, respectively. Panel c presents the corresponding zoom-in view and the bottom Q distribution. The cyan and orange field lines might reconnect and lead to the longer pink field lines above and to the short green loops below. The long yellow lines are active region magnetic field lines. Panels d and e exhibit the 1400 Å and Hα –0.8 Å images at 18:32 UT observed by the IRIS and GST, respectively. The yellow vertical line in panel d represents the IRIS slit, and the inset shows the spectra of Si IV 1403 Å. Panel f shows the reconnection configuration and the distributions of the squashing degree Q.
Current usage metrics show cumulative count of Article Views (full-text article views including HTML views, PDF and ePub downloads, according to the available data) and Abstracts Views on Vision4Press platform.
Data correspond to usage on the plateform after 2015. The current usage metrics is available 48-96 hours after online publication and is updated daily on week days.
Initial download of the metrics may take a while.