Open Access
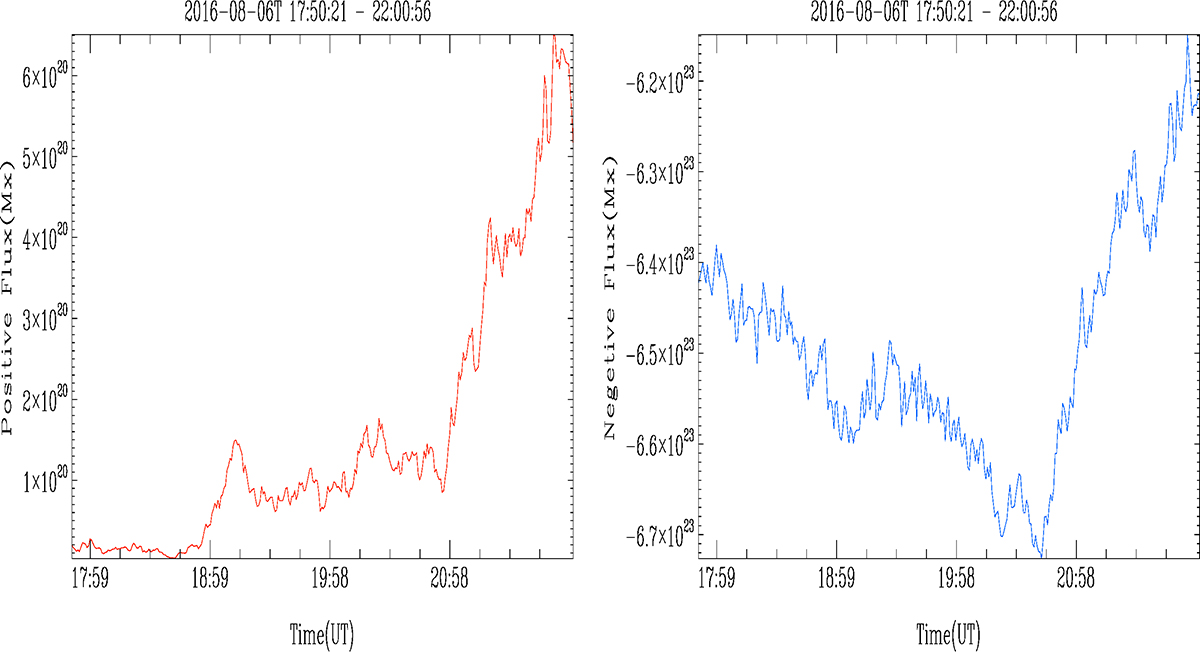
Fig. 11.
Download original image
Time-evolution diagram of positive and negative magnetic flux during the intermittent jet event. The red line represents the positive magnetic flux, and the blue line represents the negative magnetic flux.
Current usage metrics show cumulative count of Article Views (full-text article views including HTML views, PDF and ePub downloads, according to the available data) and Abstracts Views on Vision4Press platform.
Data correspond to usage on the plateform after 2015. The current usage metrics is available 48-96 hours after online publication and is updated daily on week days.
Initial download of the metrics may take a while.