Fig. 10.
Download original image
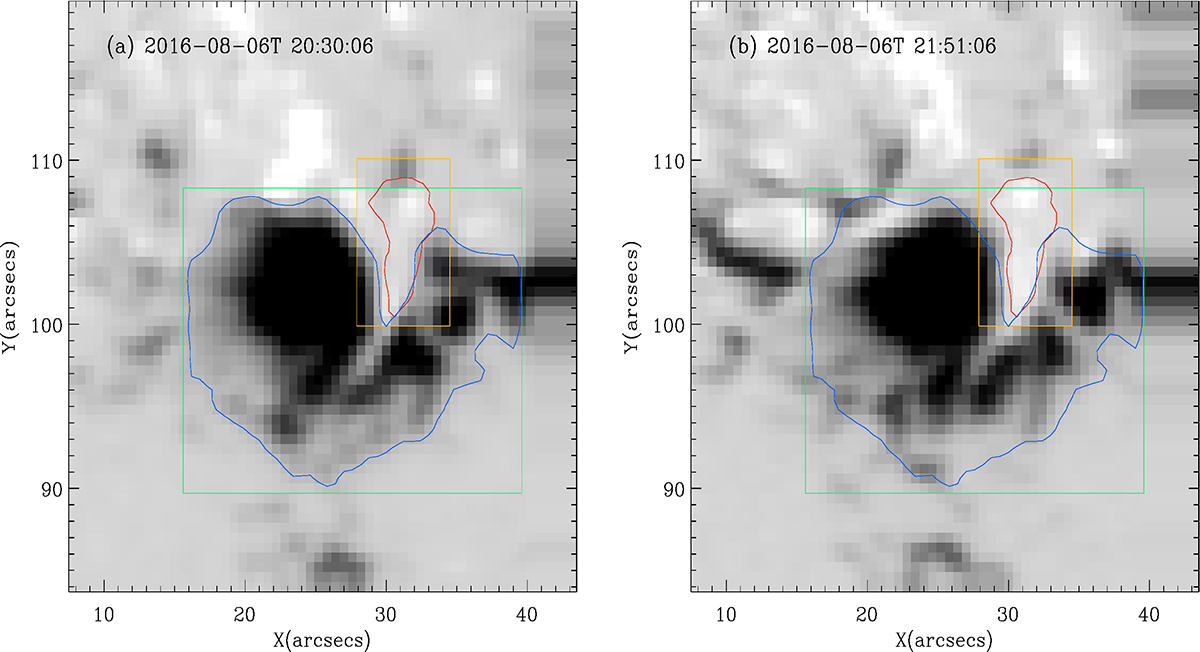
Observation image of the HMI M45s longitudinal field. The region surrounded by red lines in panels a and b is the positive polar magnetic field evolution region 1 determined by the magnetic field value at 20:30:06 UT of +25 Gauss, and the blue line is the negative polar magnetic field evolution region 2 determined by the magnetic field value at 21:51:16 UT of –120 Gauss. The yellow and green box represent the rectangular region in which the positive and negative magnetic field evolution region, respectively, is located.
Current usage metrics show cumulative count of Article Views (full-text article views including HTML views, PDF and ePub downloads, according to the available data) and Abstracts Views on Vision4Press platform.
Data correspond to usage on the plateform after 2015. The current usage metrics is available 48-96 hours after online publication and is updated daily on week days.
Initial download of the metrics may take a while.