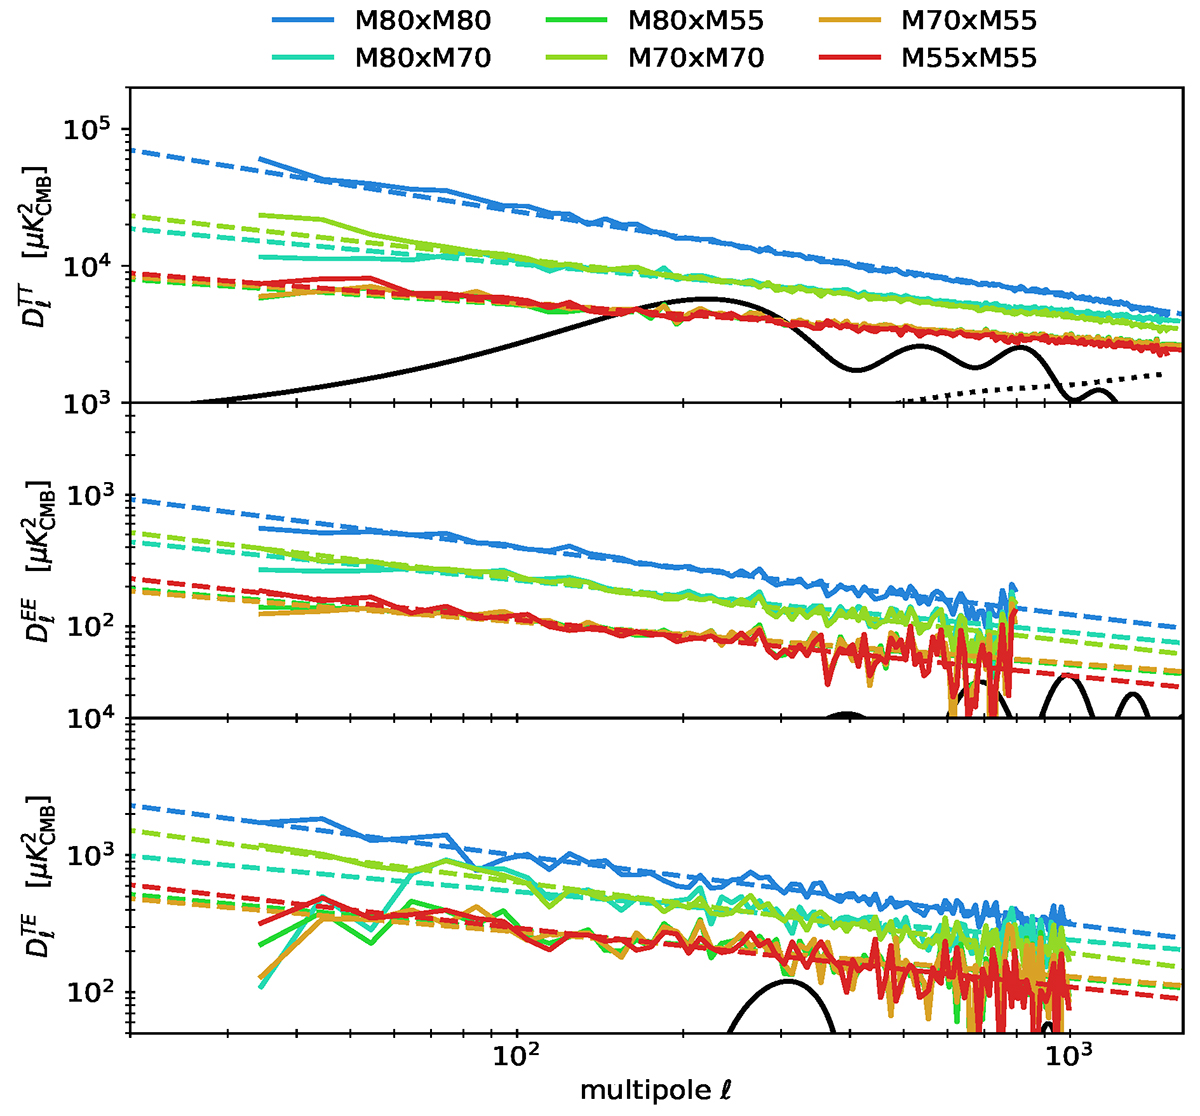
Fig. 7.
Download original image
Dust power spectra, Dℓ = ℓ(ℓ + 1)Cℓ/2π, at 353 GHz for TT (top), EE (middle), and TE (bottom). The power spectra are computed from a cross-correlation between the detset maps at 353 GHz for different sets of masks, as defined in Sect. 3.2.1, and further corrected for the CMB power spectrum (solid black line) and CIB power spectrum (dashed black line). The coloured dashed lines are simple fits, as described in the text.
Current usage metrics show cumulative count of Article Views (full-text article views including HTML views, PDF and ePub downloads, according to the available data) and Abstracts Views on Vision4Press platform.
Data correspond to usage on the plateform after 2015. The current usage metrics is available 48-96 hours after online publication and is updated daily on week days.
Initial download of the metrics may take a while.