Open Access
Fig. 3.
Download original image
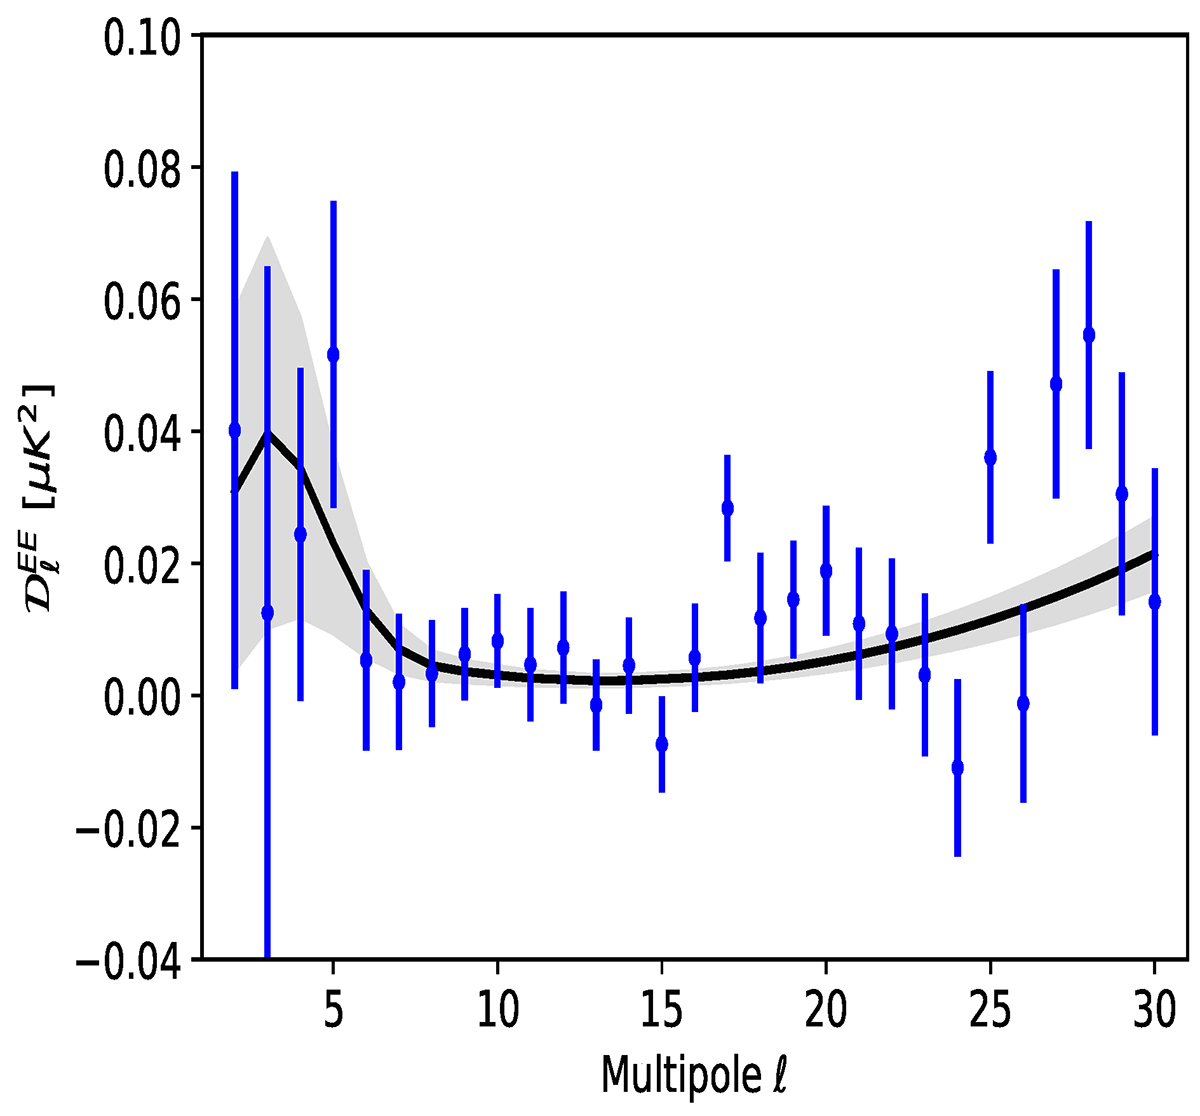
EE power spectrum of the CMB computed on 50% of the sky with the PR4 maps at low multipoles (Tristram et al. 2021). The Planck 2018 ΛCDM model is plotted in black. The grey band represents the associated sample variance. Error bars are deduced from the PR4 Monte Carlo simulations.
Current usage metrics show cumulative count of Article Views (full-text article views including HTML views, PDF and ePub downloads, according to the available data) and Abstracts Views on Vision4Press platform.
Data correspond to usage on the plateform after 2015. The current usage metrics is available 48-96 hours after online publication and is updated daily on week days.
Initial download of the metrics may take a while.