Fig. B.1.
Download original image
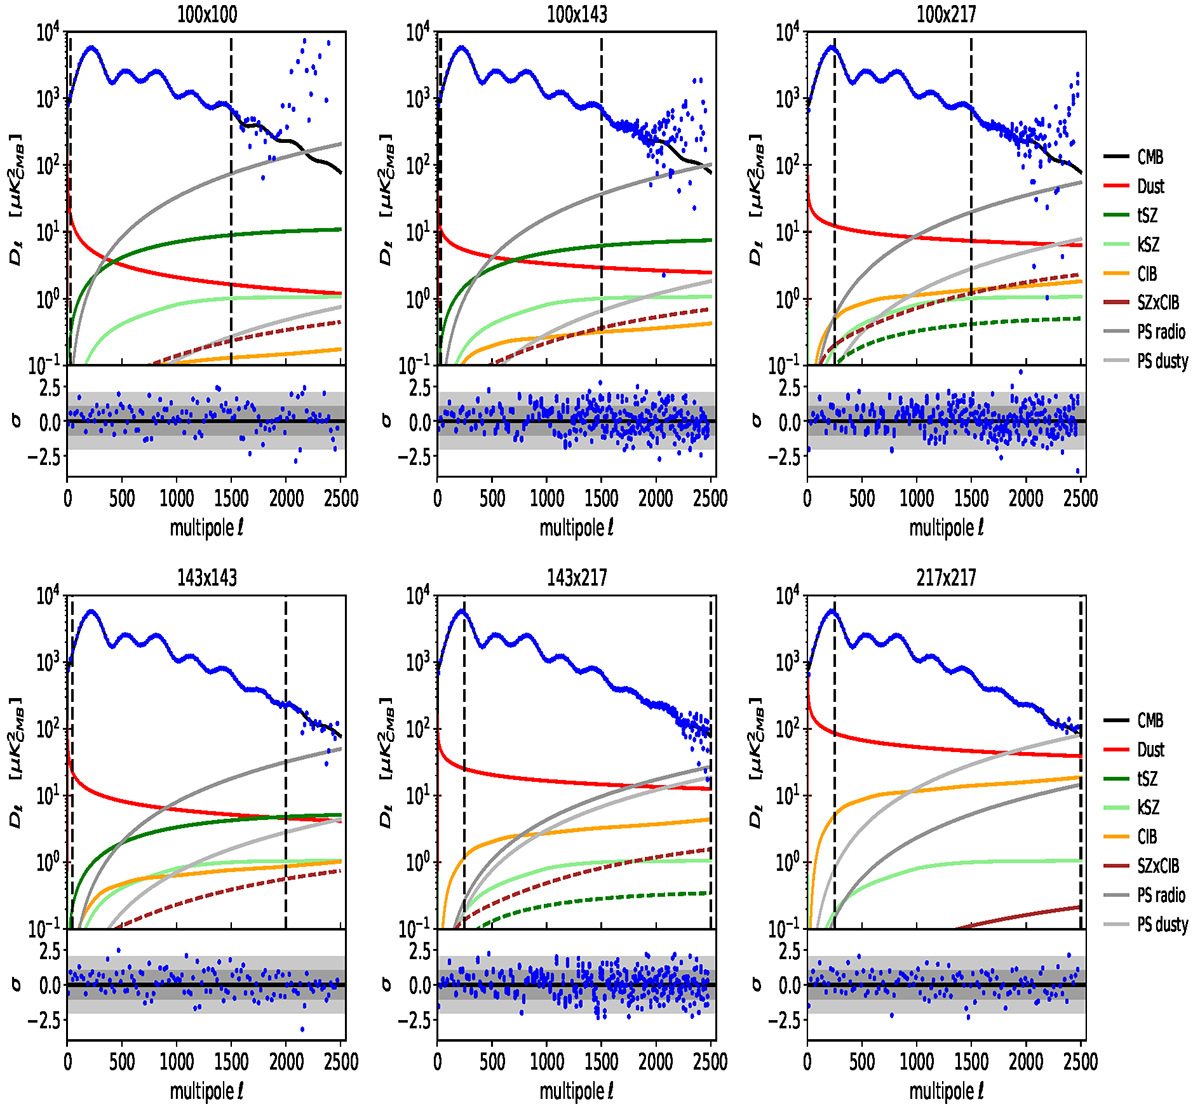
Best-fit model for each cross-frequency power spectrum in temperature, including emission from CMB, dust, tSZ, kSZ, CIB, SZ×CIB, and Poisson-noise from radio sources and dusty galaxies. Negative components are shown as dashed lines. Vertical black dashed lines show the range of multipoles considered in HiLLiPoP V4.2. The bottom panels show the residuals normalized by the error bars. Data are binned with Δℓ = 20 for this plot.
Current usage metrics show cumulative count of Article Views (full-text article views including HTML views, PDF and ePub downloads, according to the available data) and Abstracts Views on Vision4Press platform.
Data correspond to usage on the plateform after 2015. The current usage metrics is available 48-96 hours after online publication and is updated daily on week days.
Initial download of the metrics may take a while.