Fig. 13.
Download original image
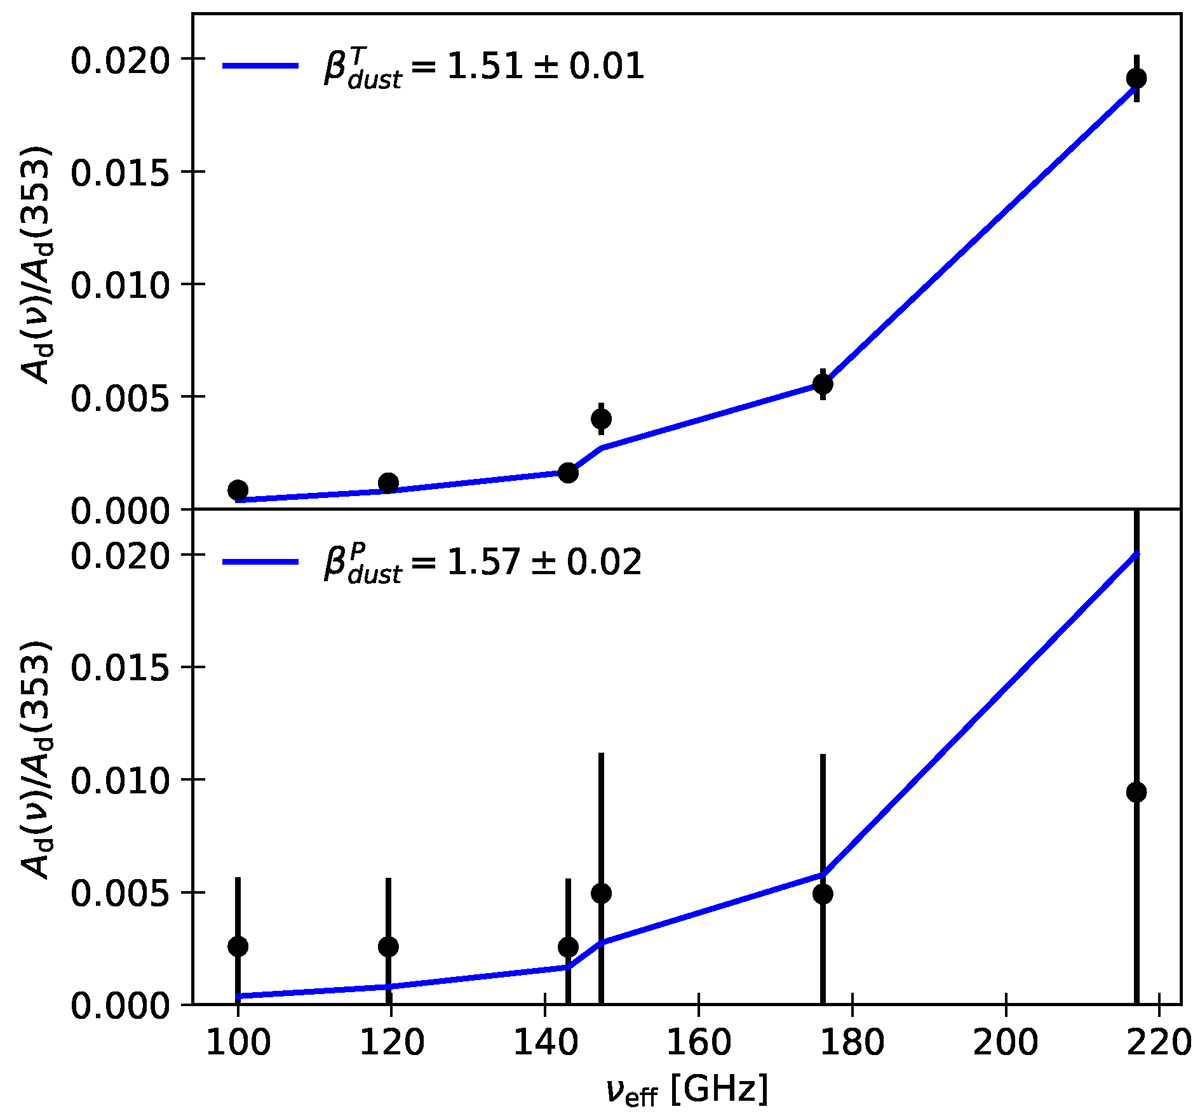
Amplitude of the dust emission relative to 353 GHz for a modified-blackbody dust model (blue line) as a function of the effective frequency (computed as the geometric mean of the two frequencies involved), compared to a fit using one amplitude per frequency (black dots). The top panel is for temperature and the bottom panel for polarization.
Current usage metrics show cumulative count of Article Views (full-text article views including HTML views, PDF and ePub downloads, according to the available data) and Abstracts Views on Vision4Press platform.
Data correspond to usage on the plateform after 2015. The current usage metrics is available 48-96 hours after online publication and is updated daily on week days.
Initial download of the metrics may take a while.