Open Access
Fig. 1.
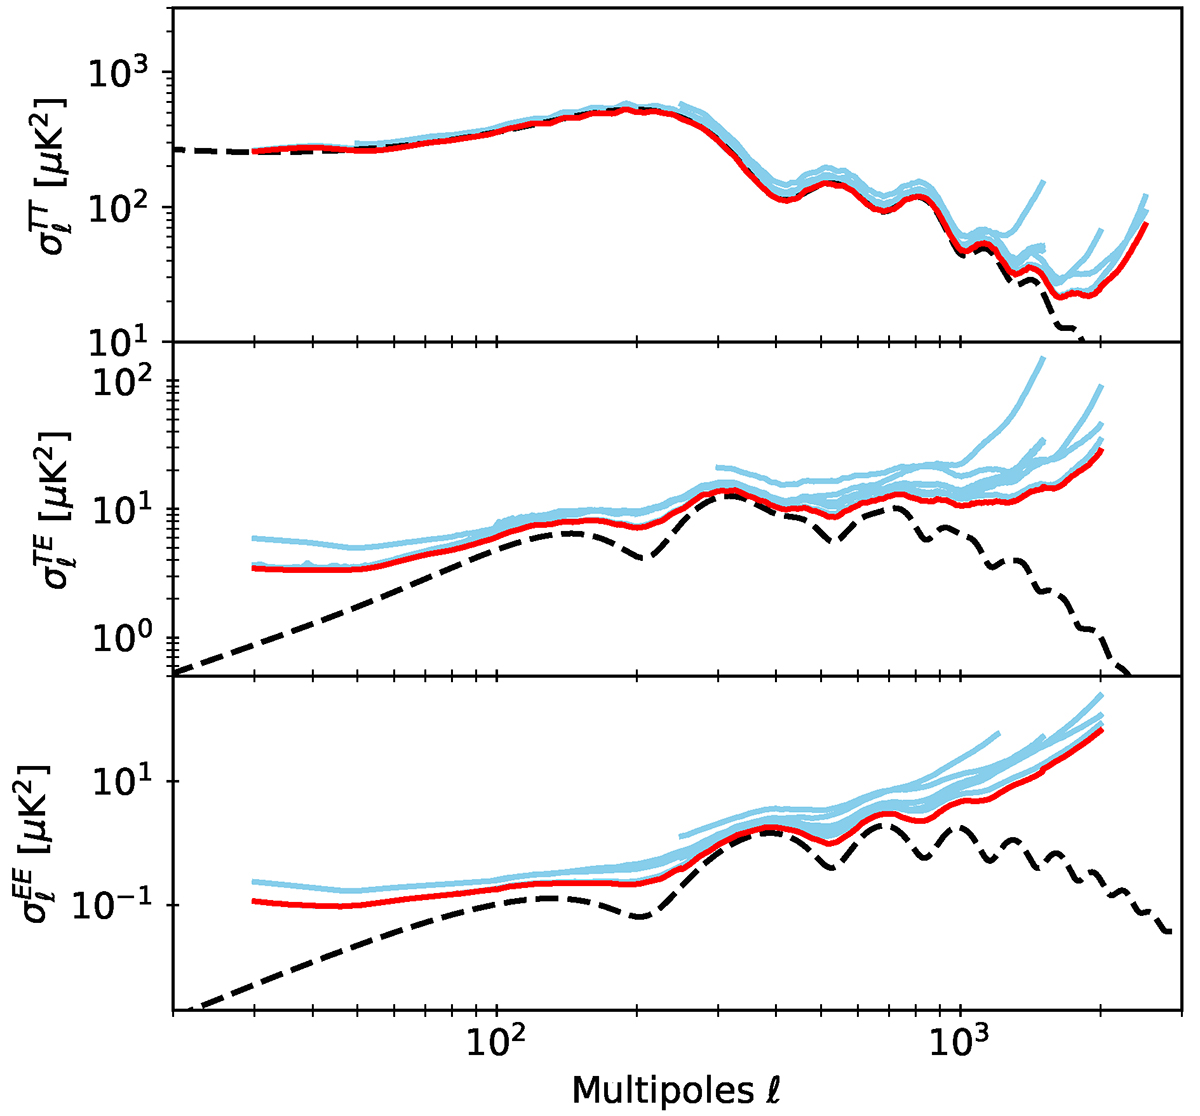
Download original image
Uncertainties on each angular cross-power spectrum (blue lines) and their combination (red line) for the PlanckTT (top), TE (middle), and EE (bottom) data, compared to sample variance for 75% of the sky (black dashed line).
Current usage metrics show cumulative count of Article Views (full-text article views including HTML views, PDF and ePub downloads, according to the available data) and Abstracts Views on Vision4Press platform.
Data correspond to usage on the plateform after 2015. The current usage metrics is available 48-96 hours after online publication and is updated daily on week days.
Initial download of the metrics may take a while.