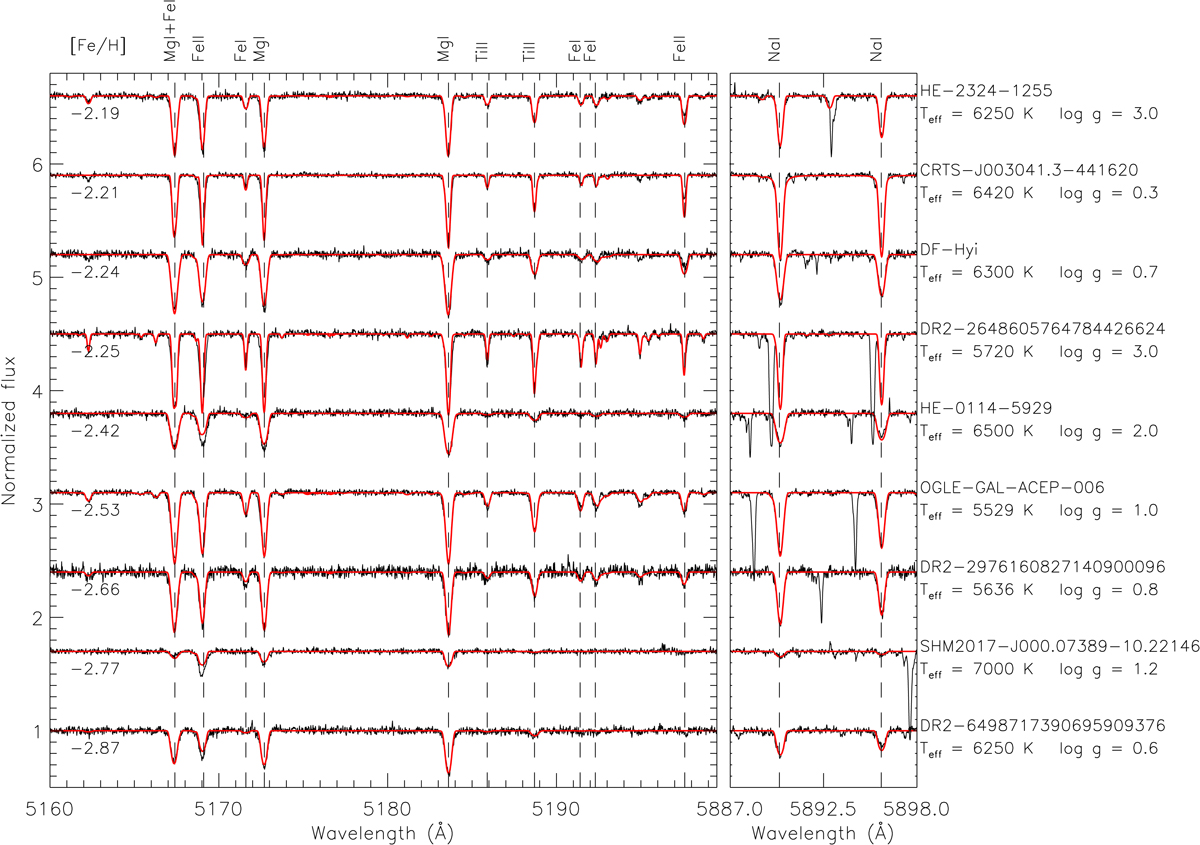
Fig. 3.
Download original image
Excerpt from our UVES spectra for the nine ACEPs. The black and red lines show the data and the best-fitting synthetic spectra, respectively. Some lines are labelled in the figure, as is the iron abundance. In the right panel, we show the fit of the Na I doublet at 5889–5895 Å. It is possible to note the interstellar sodium lines in four out of nine stars, for which we accurately fit only the line profile of the stellar sodium.
Current usage metrics show cumulative count of Article Views (full-text article views including HTML views, PDF and ePub downloads, according to the available data) and Abstracts Views on Vision4Press platform.
Data correspond to usage on the plateform after 2015. The current usage metrics is available 48-96 hours after online publication and is updated daily on week days.
Initial download of the metrics may take a while.