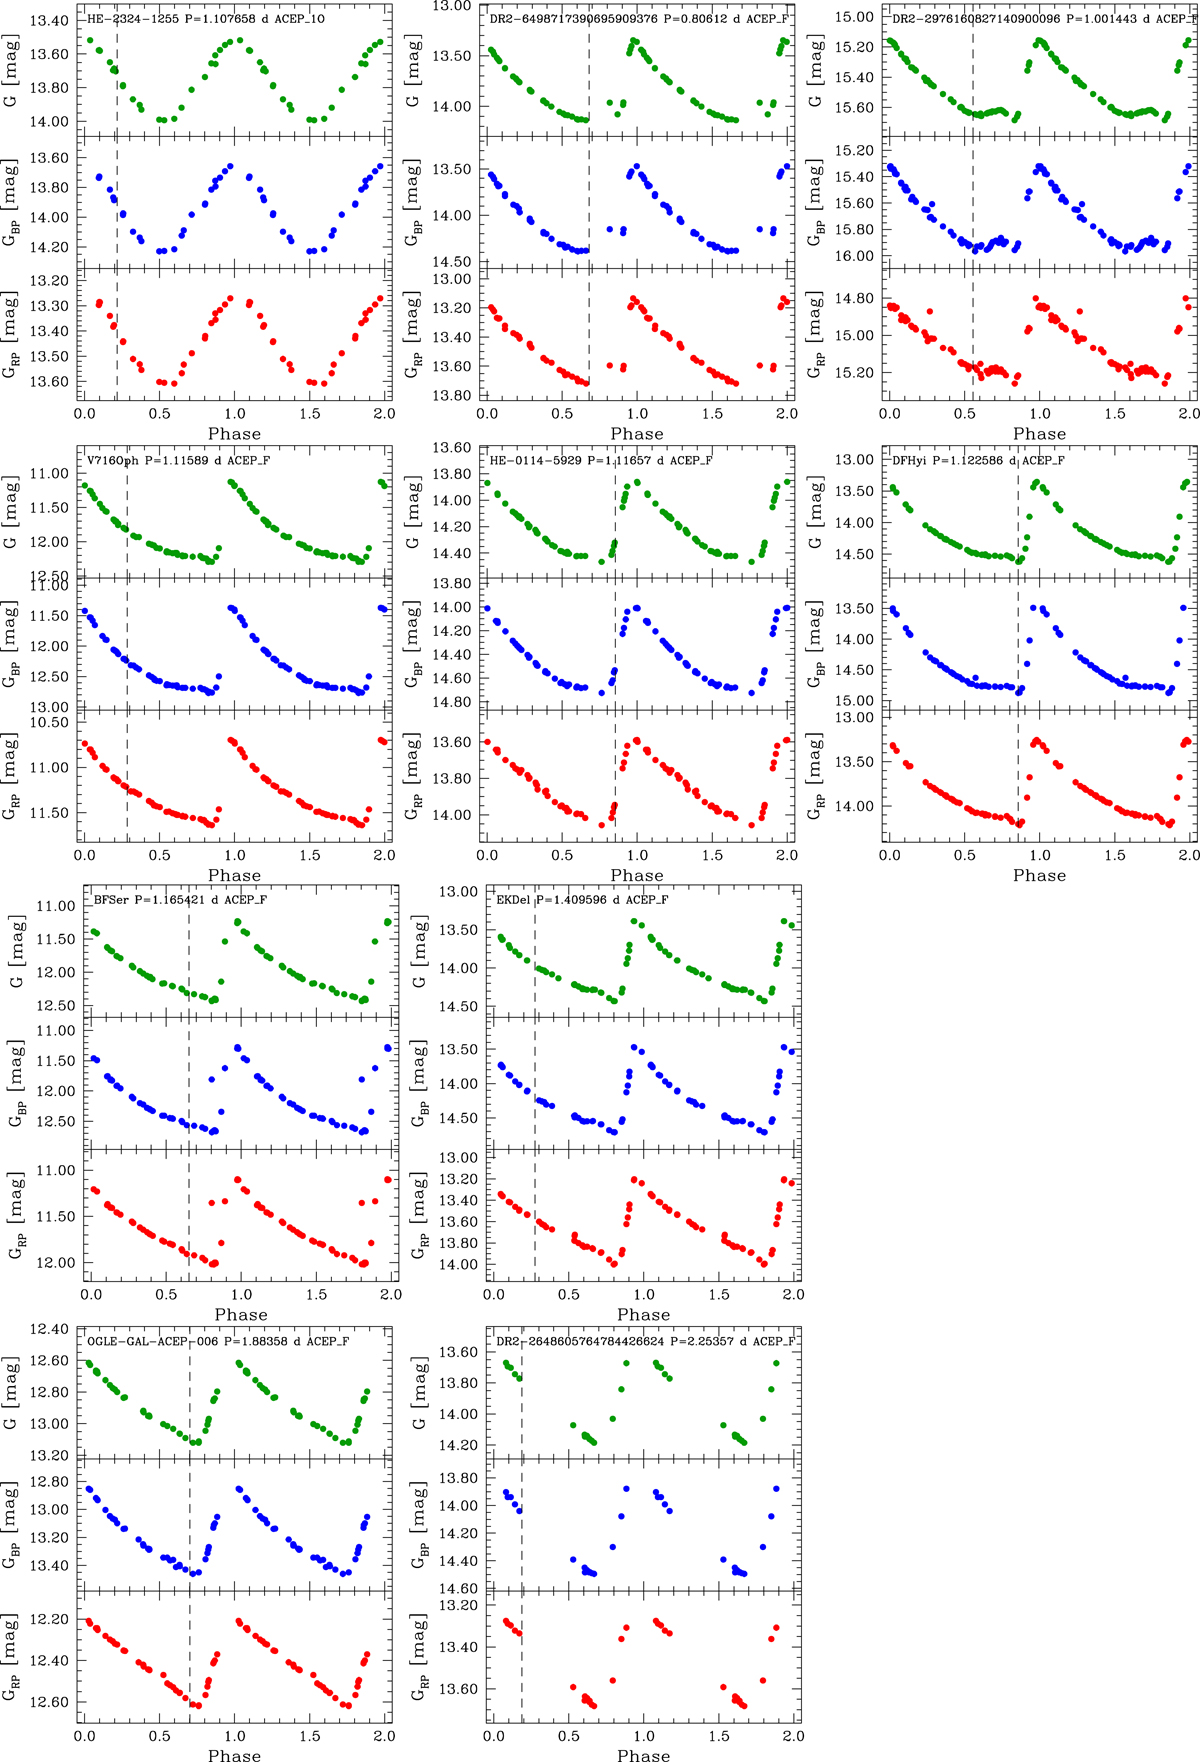
Fig. A.1.
Download original image
Light curves for the target stars in the Gaia bands. The vertical line shows the phase corresponding to the spectroscopic observations. For BF Ser, EK Del, and V716 Oph, the phases were taken from the literature. In particular, the line is only indicative for BF Ser and EK Del, for which multiple epochs of observations are available (see text for details).
Current usage metrics show cumulative count of Article Views (full-text article views including HTML views, PDF and ePub downloads, according to the available data) and Abstracts Views on Vision4Press platform.
Data correspond to usage on the plateform after 2015. The current usage metrics is available 48-96 hours after online publication and is updated daily on week days.
Initial download of the metrics may take a while.