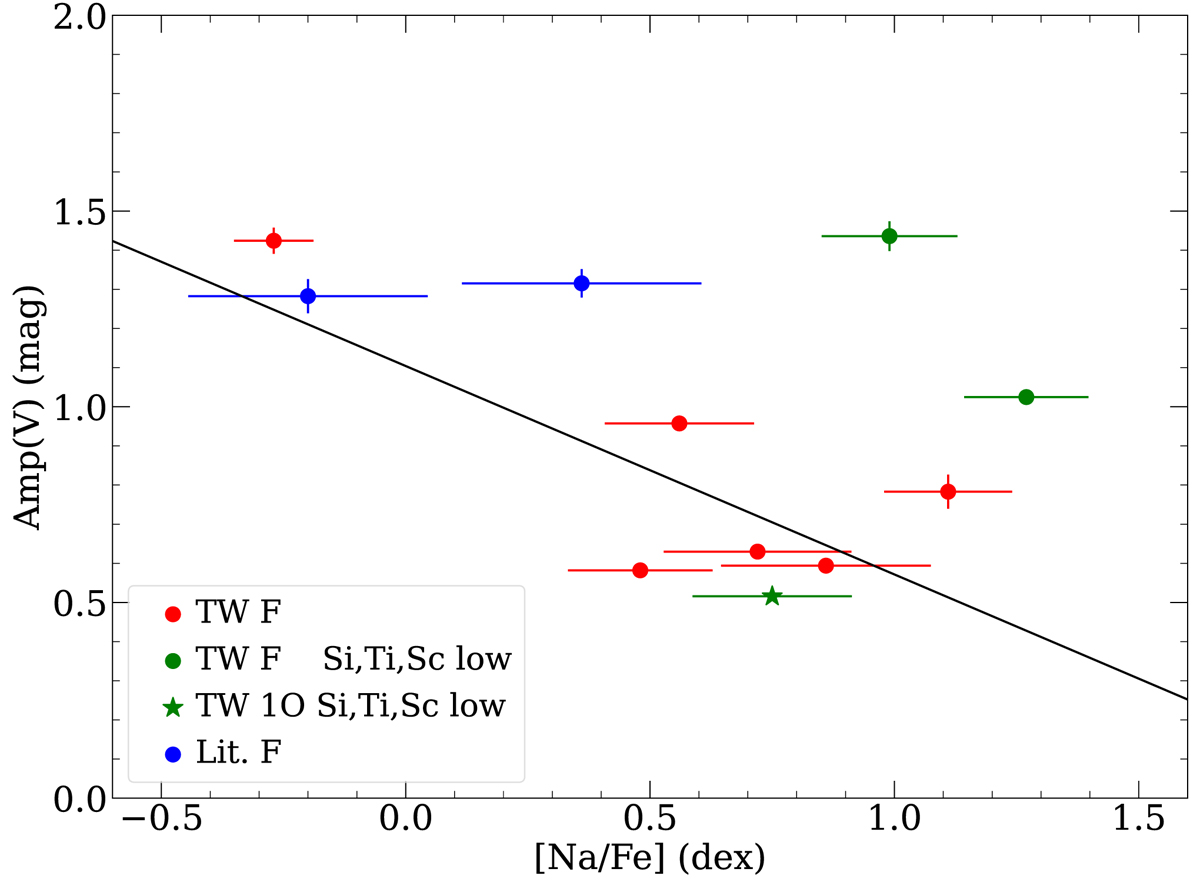
Fig. 14.
Download original image
Visual amplitude of the observed ACEPs as a function of the [Na/Fe] abundance. The solid line shows a linear regression to the data that does not include the three stars with low values of the [Si/Fe], [Ti/Fe] and [Sc/Fe] abundances (green symbols, see labels). In the labels, TW and Lit. indicate the nine stars that were studied spectroscopically in this paper and the three with spectroscopy from the literature, respectively.
Current usage metrics show cumulative count of Article Views (full-text article views including HTML views, PDF and ePub downloads, according to the available data) and Abstracts Views on Vision4Press platform.
Data correspond to usage on the plateform after 2015. The current usage metrics is available 48-96 hours after online publication and is updated daily on week days.
Initial download of the metrics may take a while.