Fig. 4
Download original image
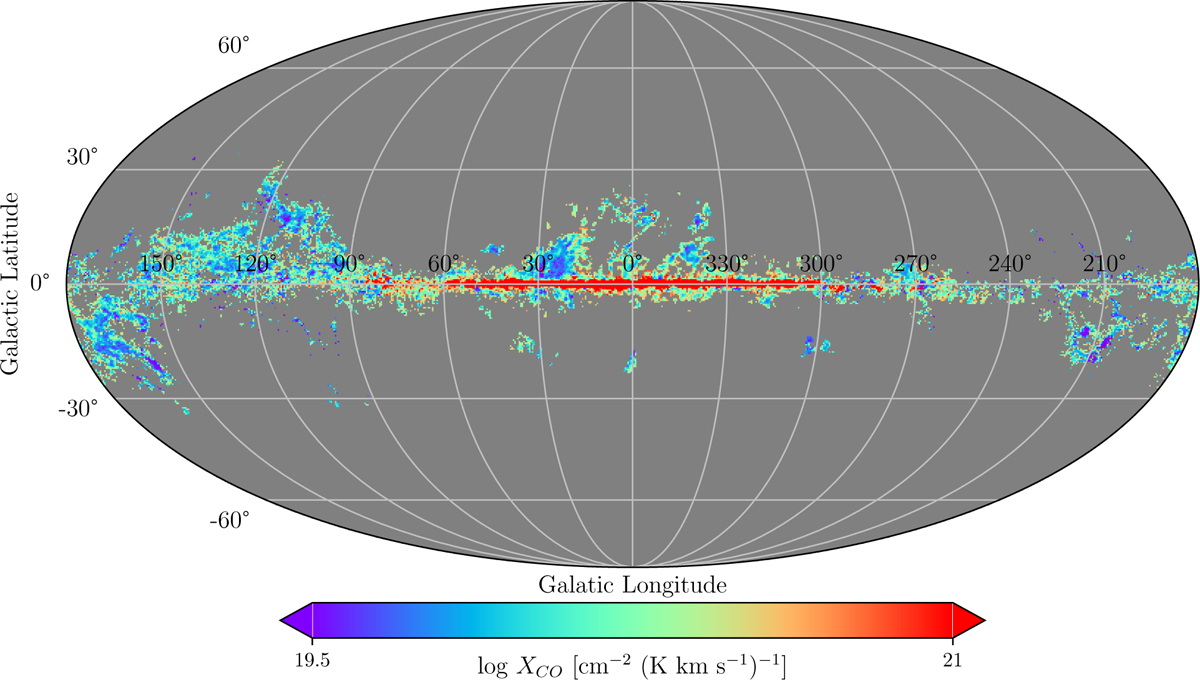
Mollweide projection of our constructed XCO map. Our global value for XCO is 2 × 10²⁰ K km s−1 cm−2, which is consistent with previous estimates. XCO varies by orders of magnitude within a few tens of arcminutes. In the surroundings of molecular regions, XCO ~ 1021 cm−2 (K km s−1)−1, while in the inner parts of clouds it decreases to XCO ~ 5 × 1019 cm−2 (K km s−1)−1. In the Galactic center, XCO increases significantly due to the high optical depths in that region. The angular resolution is 16′, and NSIDE=1024.
Current usage metrics show cumulative count of Article Views (full-text article views including HTML views, PDF and ePub downloads, according to the available data) and Abstracts Views on Vision4Press platform.
Data correspond to usage on the plateform after 2015. The current usage metrics is available 48-96 hours after online publication and is updated daily on week days.
Initial download of the metrics may take a while.