Fig. 3
Download original image
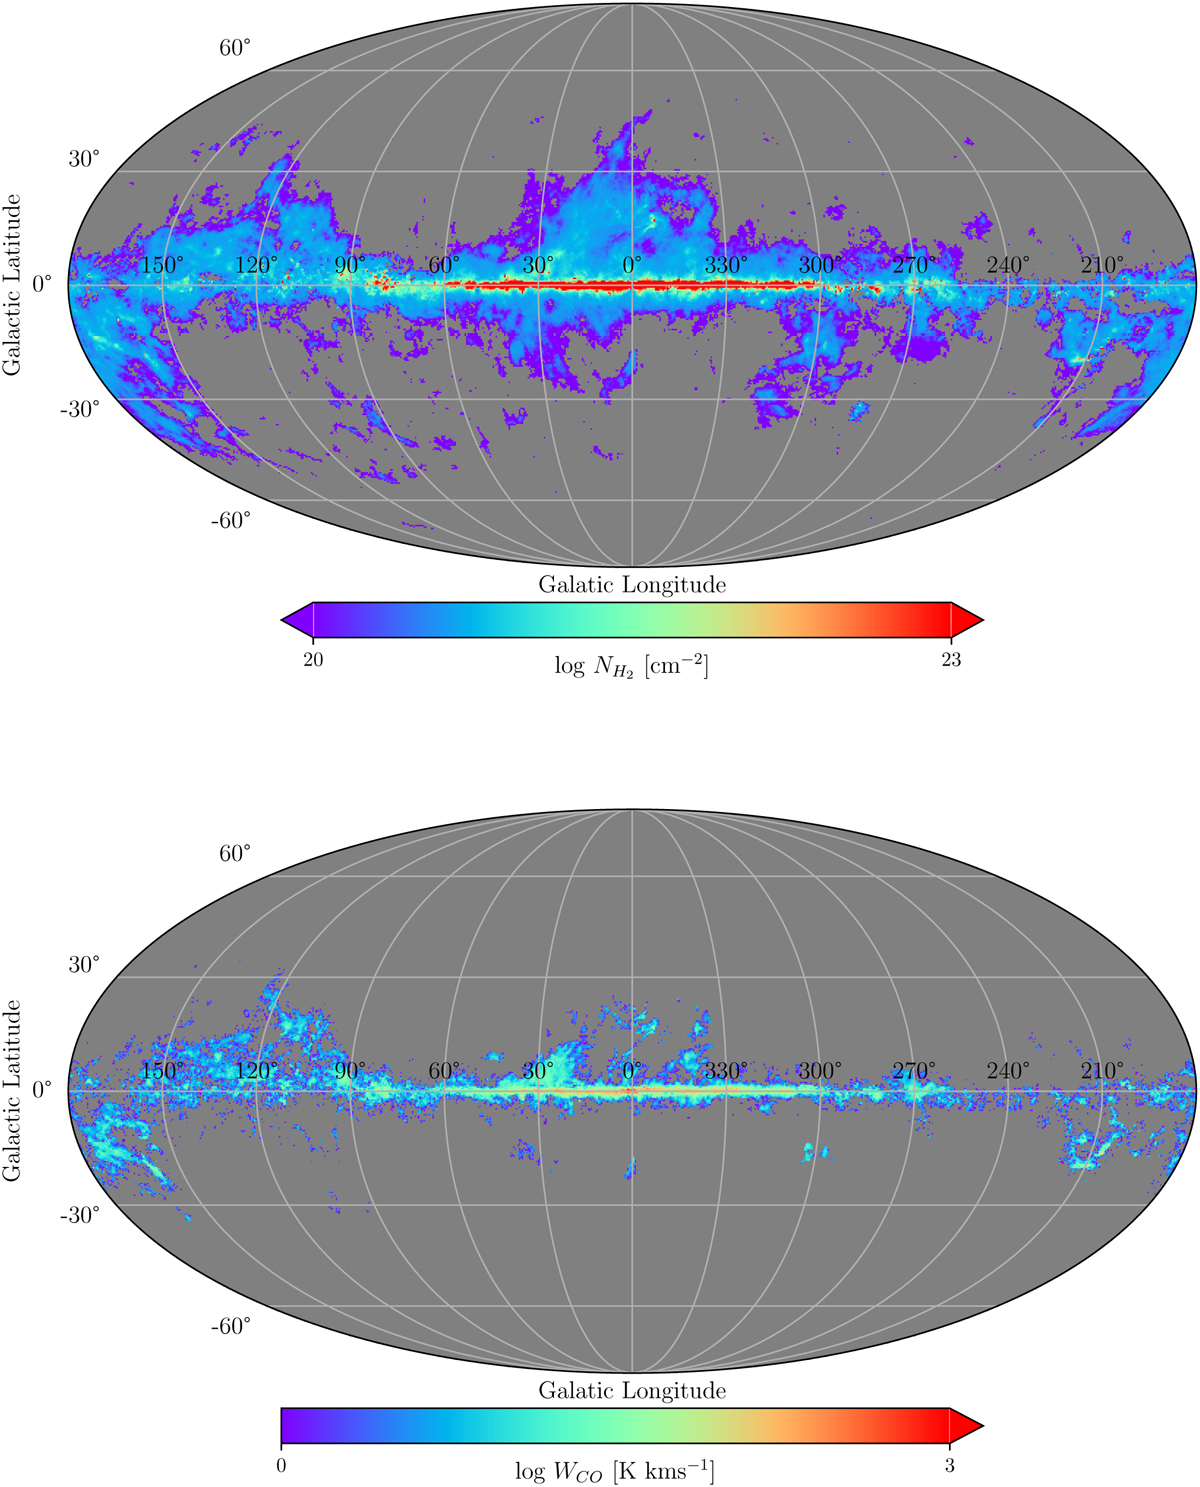
Comparison between ![]() and WCO maps. Top panel: Mollweide projection of our
and WCO maps. Top panel: Mollweide projection of our ![]() map. The dark blue color indicates regions with
map. The dark blue color indicates regions with ![]() . Bottom panel: WCO map from Dame et al. (2001). Our
. Bottom panel: WCO map from Dame et al. (2001). Our ![]() map was constructed by calculating AV(H2), using E(B − V) and NH I data, and then converting to
map was constructed by calculating AV(H2), using E(B − V) and NH I data, and then converting to ![]() using the relation given in Eq. (7). The
using the relation given in Eq. (7). The ![]() map shows several relatively large angular scale structures. As these are CO-dark H2 regions, they are undetectable in the WCO map. (Sect. 5.2). In both maps, longitude increases to the left from the central (vertical) line at ℓ = 0°, the grid spacing, shown by the white solid lines, is 30°, the angular resolution is 16′, and the HEALPix parameter NSIDE = 1024.
map shows several relatively large angular scale structures. As these are CO-dark H2 regions, they are undetectable in the WCO map. (Sect. 5.2). In both maps, longitude increases to the left from the central (vertical) line at ℓ = 0°, the grid spacing, shown by the white solid lines, is 30°, the angular resolution is 16′, and the HEALPix parameter NSIDE = 1024.
Current usage metrics show cumulative count of Article Views (full-text article views including HTML views, PDF and ePub downloads, according to the available data) and Abstracts Views on Vision4Press platform.
Data correspond to usage on the plateform after 2015. The current usage metrics is available 48-96 hours after online publication and is updated daily on week days.
Initial download of the metrics may take a while.