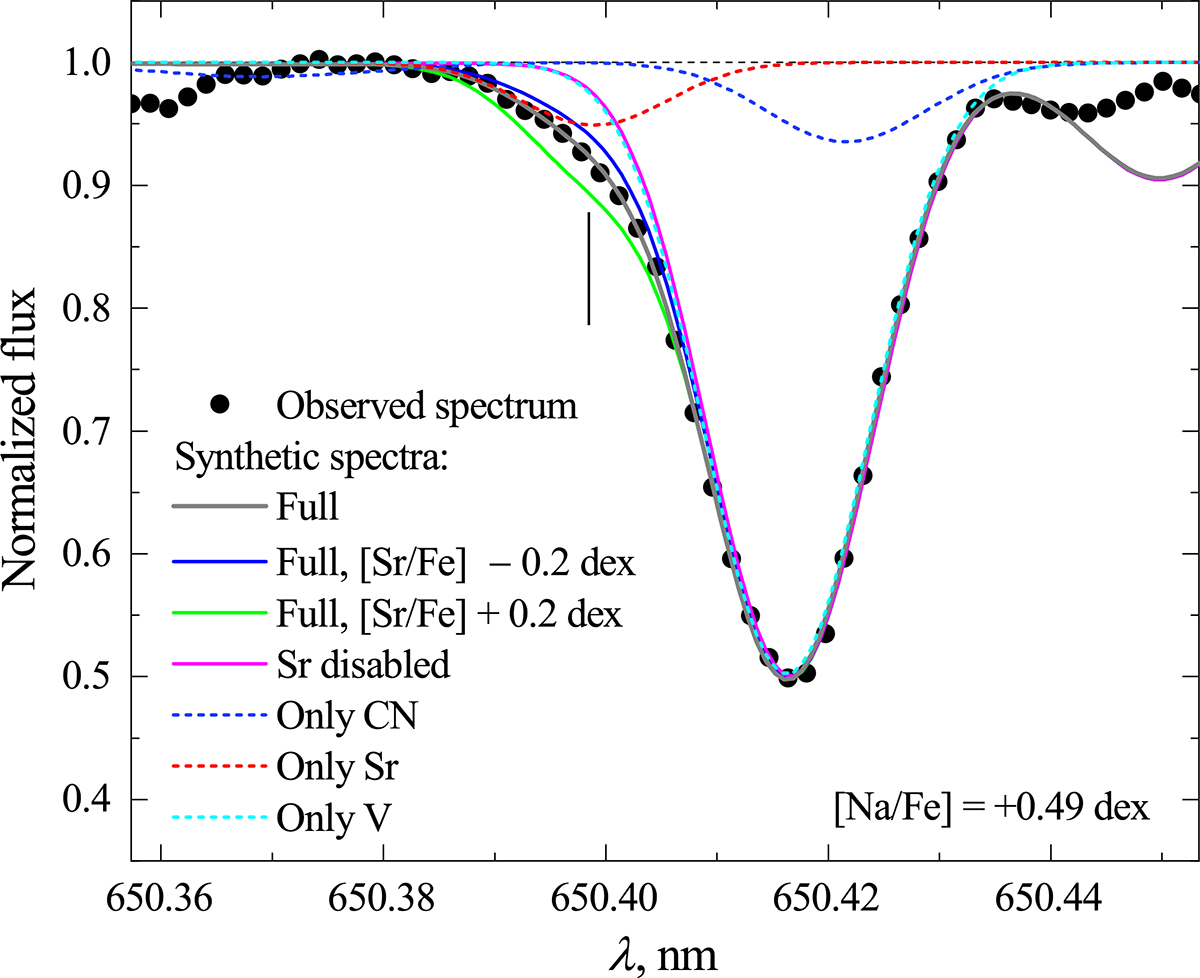
Fig. 9.
Download original image
Sr I line in the UVES spectrum of the program star 27678 (dots) overlaid with the synthetic spectrum (solid gray line) that was calculated using the ATLAS9 model with Teff = 3958 K, log g = 0.87, [Fe/H] = −0.79, ξmicro = 1.56 km s−1, ξmacro = 6.20 km s−1, [Sr/Fe] = 0.02 dex. The other elemental abundances are scaled to solar (Grevesse & Sauval 1998). The other lines show the synthetic spectra of the full synthetic spectrum with the strontium abundance lowered and enhanced by 0.2 dex (solid blue and green lines, respectively), the full synthetic spectrum without the Sr I 650.3991 nm line (solid magenta line), the CN lines alone (dashed blue line), the Sr I line alone (dashed red line), and the V I 650.4165 nm line alone (dashed cyan line).
Current usage metrics show cumulative count of Article Views (full-text article views including HTML views, PDF and ePub downloads, according to the available data) and Abstracts Views on Vision4Press platform.
Data correspond to usage on the plateform after 2015. The current usage metrics is available 48-96 hours after online publication and is updated daily on week days.
Initial download of the metrics may take a while.