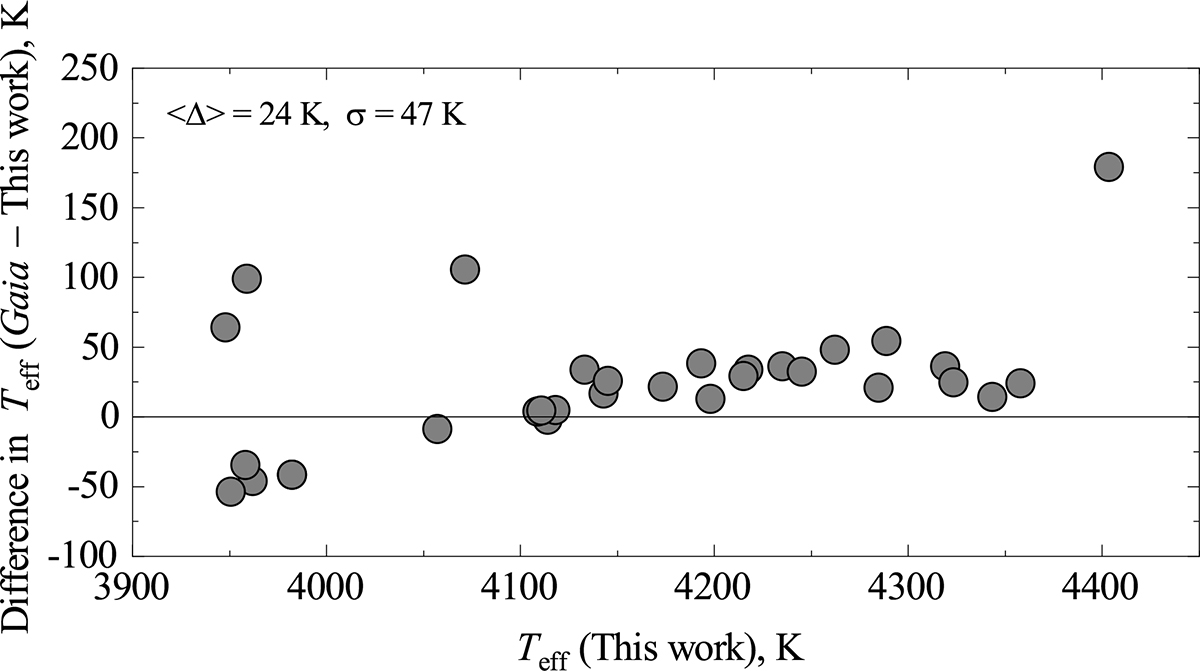
Fig. 2.
Download original image
Effective temperatures determined using the Gaia DR3 photometry vs. those obtained using photometry from Bergbusch & Stetson (2009, the latter values of effective temperatures were used in this work). The mean difference between the two sets of effective temperatures and the scatter around this value (measured as the standard deviation, σ) are shown in the top left corner of the figure.
Current usage metrics show cumulative count of Article Views (full-text article views including HTML views, PDF and ePub downloads, according to the available data) and Abstracts Views on Vision4Press platform.
Data correspond to usage on the plateform after 2015. The current usage metrics is available 48-96 hours after online publication and is updated daily on week days.
Initial download of the metrics may take a while.