Open Access
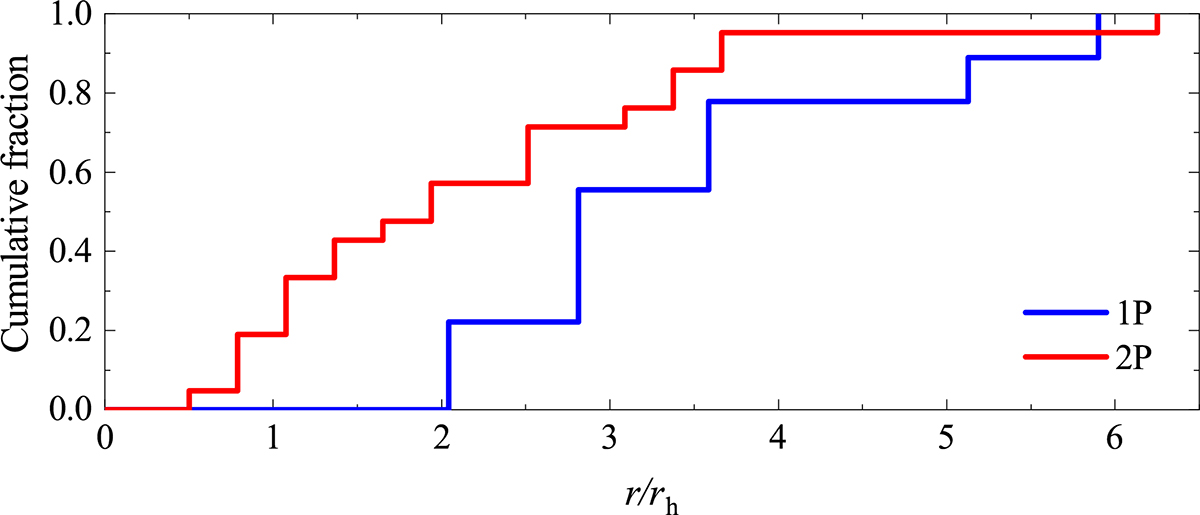
Fig. 17.
Download original image
Cumulative number fraction of the stars in the Na-rich (red line) and Na-poor (blue line) populations plotted vs. the relative distance from the cluster center. The results of the K–S test show that the probability of the 1P and 2P groups to be drawn from the same sample is p = 0.052.
Current usage metrics show cumulative count of Article Views (full-text article views including HTML views, PDF and ePub downloads, according to the available data) and Abstracts Views on Vision4Press platform.
Data correspond to usage on the plateform after 2015. The current usage metrics is available 48-96 hours after online publication and is updated daily on week days.
Initial download of the metrics may take a while.