Fig. 11.
Download original image
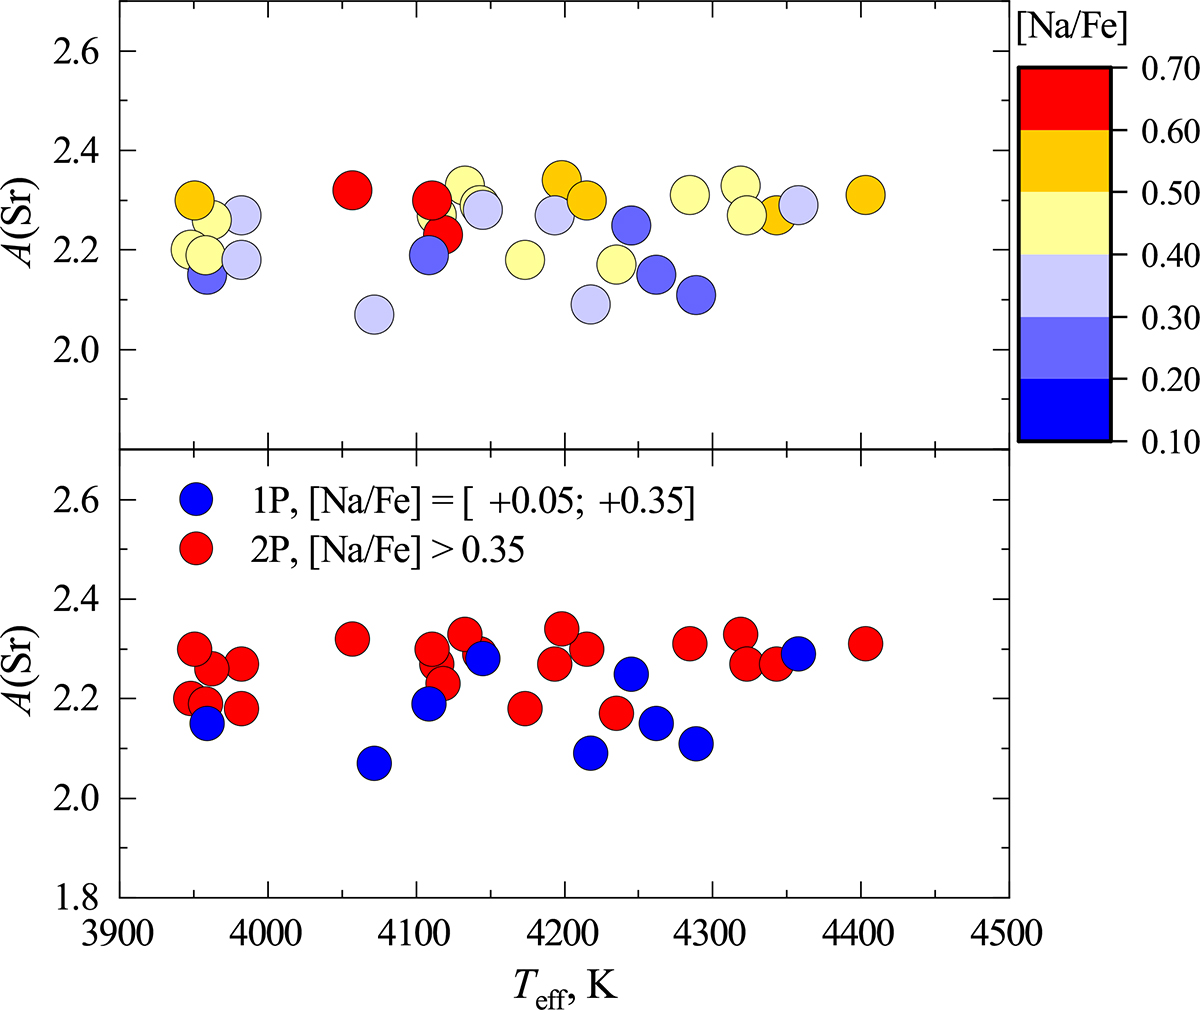
Strontium abundance in the target stars plotted vs. effective temperature. Top: Stars are marked in different colors according to their sodium abundances. Bottom: Blue circles show 1P stars ([Na/Fe] = [[Na/Fe]min, [Na/Fe]min + 0.3]), and red circles show 2P stars (those with higher Na abundances). The minimum sodium value, [Na/Fe]min = 0.05, was taken from Kolomiecas et al. (2022).
Current usage metrics show cumulative count of Article Views (full-text article views including HTML views, PDF and ePub downloads, according to the available data) and Abstracts Views on Vision4Press platform.
Data correspond to usage on the plateform after 2015. The current usage metrics is available 48-96 hours after online publication and is updated daily on week days.
Initial download of the metrics may take a while.