Fig. 2.
Download original image
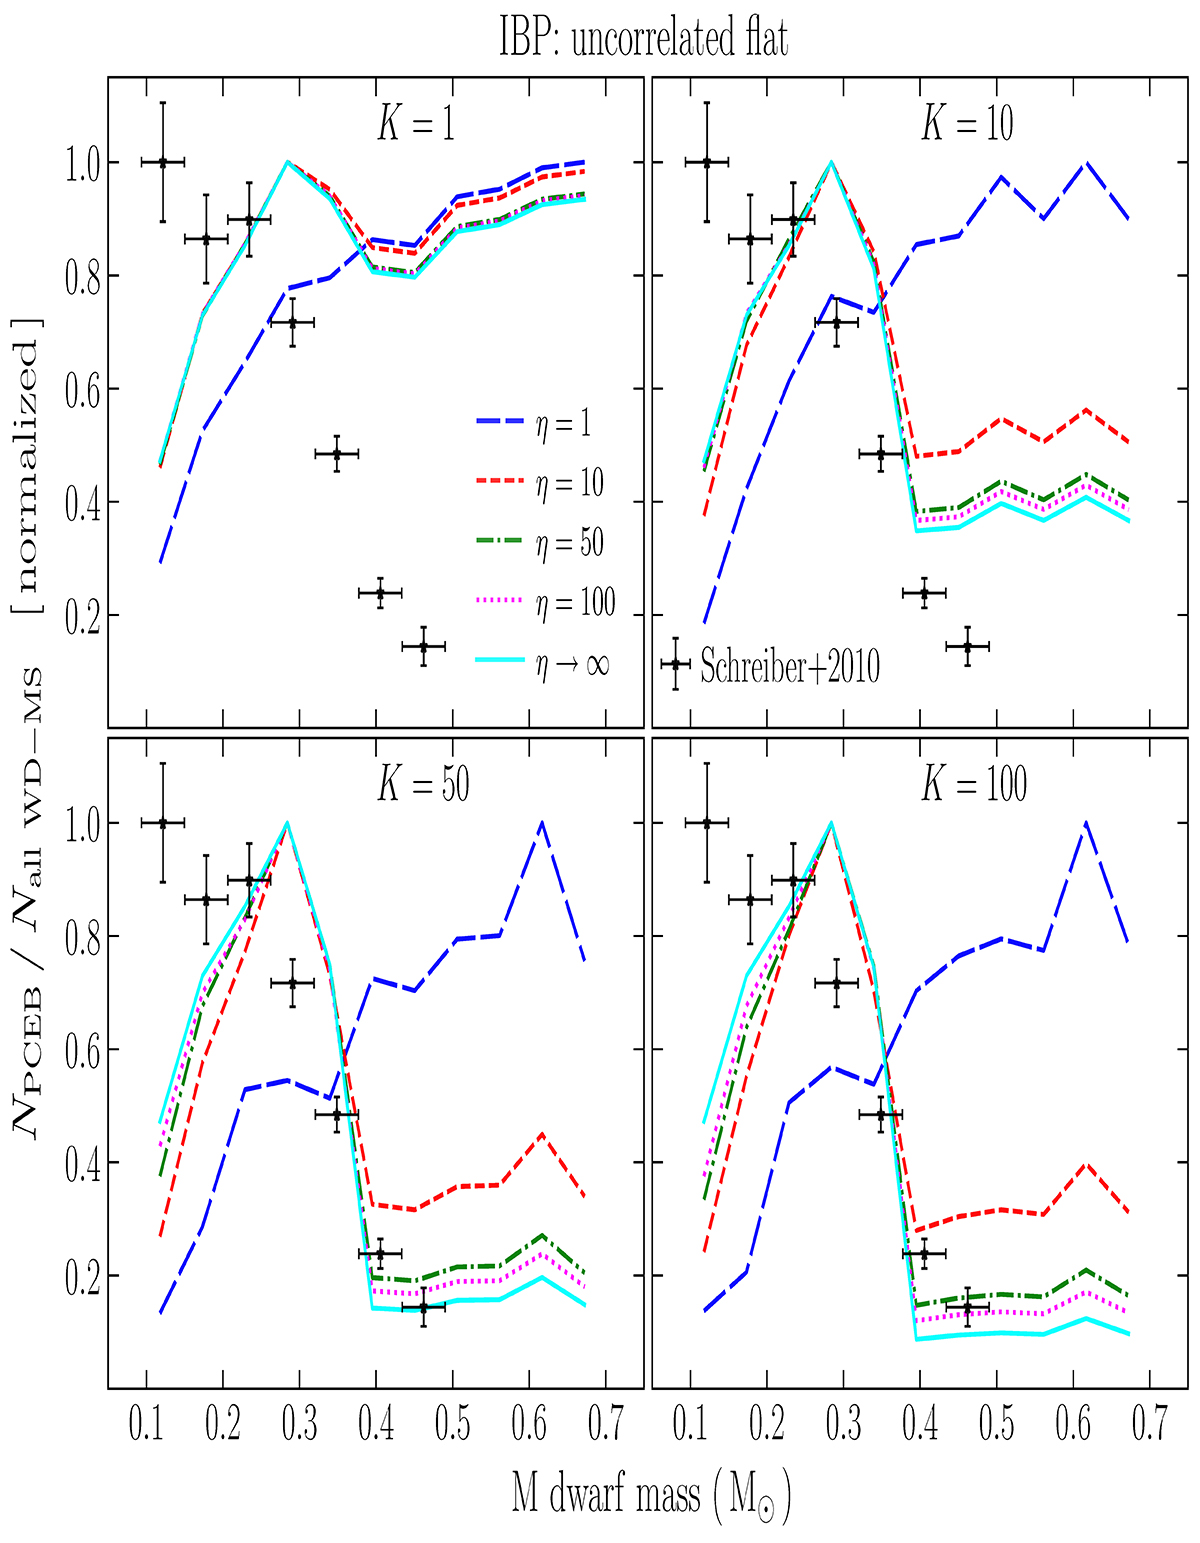
Comparison between the observed fractions of PCEBs amongst white dwarf plus M dwarf binaries across the M dwarf mass (Schreiber et al. 2010) and the predicted with Eq. (4) for several combinations of model parameters. Both predicted and observed fractions were normalized at their highest values. Each panel corresponds to a different choice for K, while the line colour and type indicate the assumed value of η. We can see that any combination of the parameters such that K ≳ 50 and η ≳ 50 is able to explain the high fraction of systems reasonably well for M dwarf masses ≲0.3 M⊙ as well as the huge reduction of systems at ∼0.5 M⊙.
Current usage metrics show cumulative count of Article Views (full-text article views including HTML views, PDF and ePub downloads, according to the available data) and Abstracts Views on Vision4Press platform.
Data correspond to usage on the plateform after 2015. The current usage metrics is available 48-96 hours after online publication and is updated daily on week days.
Initial download of the metrics may take a while.