Fig. 5
Download original image
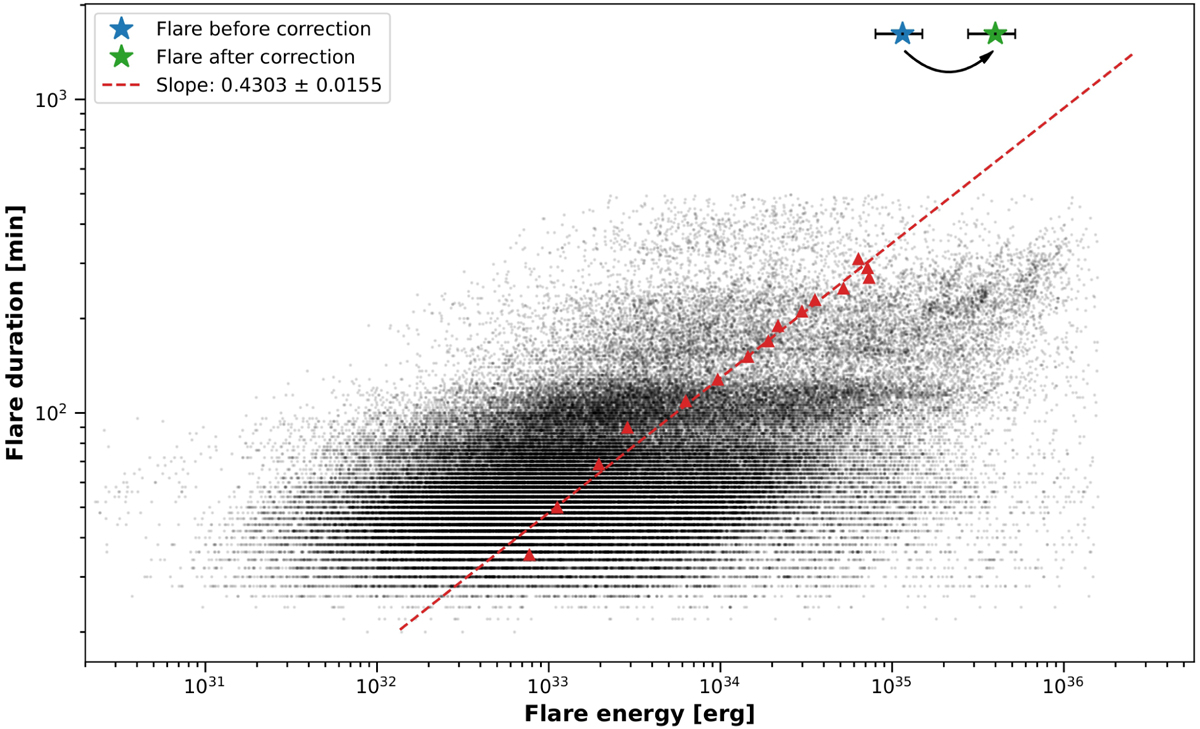
Observed relations between flare energy and duration time. All of the flares detected in the TESS data by Pietras et al. (2022) are marked with black dots. The discrete flare duration bins result from the time resolution of the observations, which is equal to 2 min. The red triangles show the location of the centers of mass and the red dashed line presents the power-law fit. The centers of mass are the median duration time and median energy of the flares divided into 15 parts. The blue star and the green star show the energy of the analyzed flare before and after correction for rotational modulation, respectively. The black arrow presents the shift in energy between the modulated and demodulated flare.
Current usage metrics show cumulative count of Article Views (full-text article views including HTML views, PDF and ePub downloads, according to the available data) and Abstracts Views on Vision4Press platform.
Data correspond to usage on the plateform after 2015. The current usage metrics is available 48-96 hours after online publication and is updated daily on week days.
Initial download of the metrics may take a while.