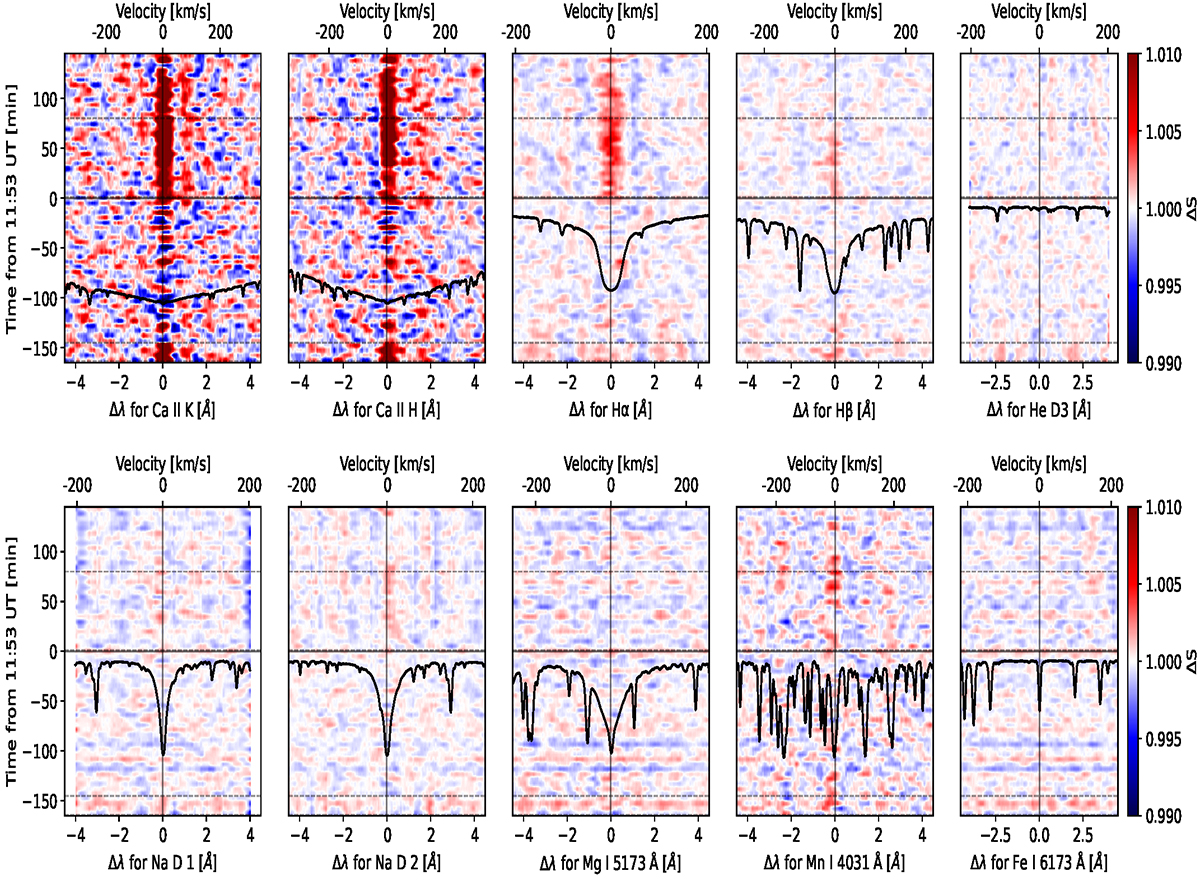
Fig. 4.
Download original image
Contrast profiles spanning the entire HARPS-N time series of 10 spectral regions that are centered on the Ca II H & K, Hα, Hβ, He ID3, Na ID1 and D2, Mg I 5173 Å Mn I 4031 Å, and Fe I 6173 Å. Each plot shows both the wavelength and Doppler velocity centered at each respective line versus the time starting from the beginning of the X9.3 flare.
Current usage metrics show cumulative count of Article Views (full-text article views including HTML views, PDF and ePub downloads, according to the available data) and Abstracts Views on Vision4Press platform.
Data correspond to usage on the plateform after 2015. The current usage metrics is available 48-96 hours after online publication and is updated daily on week days.
Initial download of the metrics may take a while.