Fig. 3.
Download original image
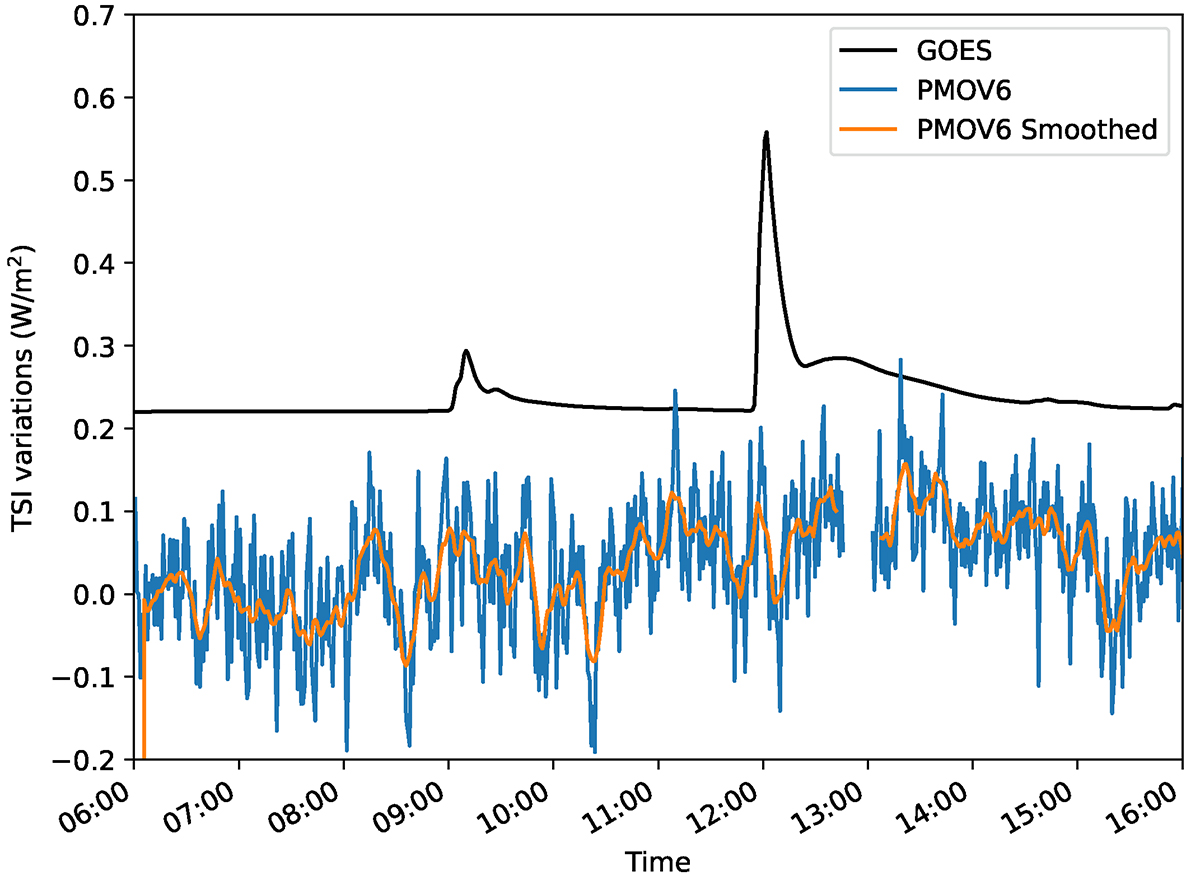
TSI variation during on 6 September 2017 at a 60-s cadence (blue) and a corresponding smoothed curve over 10 time steps (orange). While both flares are clearly visible in the scaled GOES X-ray flux (black), a TSI flare signature is absent. The standard deviation of the PMOV6-A time series is 0.06 W m−2, and the mean TSI is 1359.50 W m−2.
Current usage metrics show cumulative count of Article Views (full-text article views including HTML views, PDF and ePub downloads, according to the available data) and Abstracts Views on Vision4Press platform.
Data correspond to usage on the plateform after 2015. The current usage metrics is available 48-96 hours after online publication and is updated daily on week days.
Initial download of the metrics may take a while.