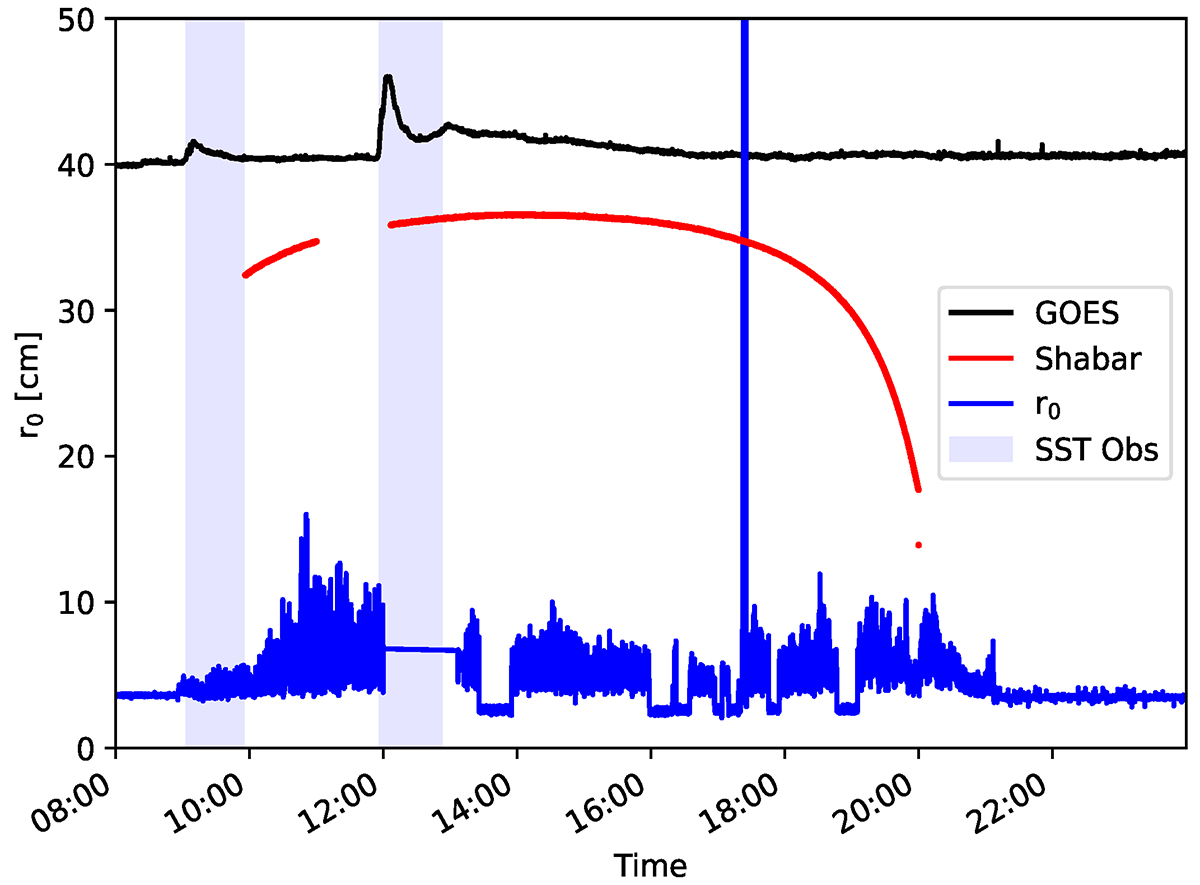
Fig. 2.
Download original image
Overview of the weather and seeing conditions at the SST on 6 September 2017. The red curve represents the solar intensity in arbitrary units as measured by the SHABAR showing a smooth curve, which indicates a cloud-free day. The Fried parameter r0 is plotted in blue. The black curve represents the scaled GOES X-ray flux, and the vertical light-blue bands in the background refer to times when the SST flare data were taken.
Current usage metrics show cumulative count of Article Views (full-text article views including HTML views, PDF and ePub downloads, according to the available data) and Abstracts Views on Vision4Press platform.
Data correspond to usage on the plateform after 2015. The current usage metrics is available 48-96 hours after online publication and is updated daily on week days.
Initial download of the metrics may take a while.