Fig. 13.
Download original image
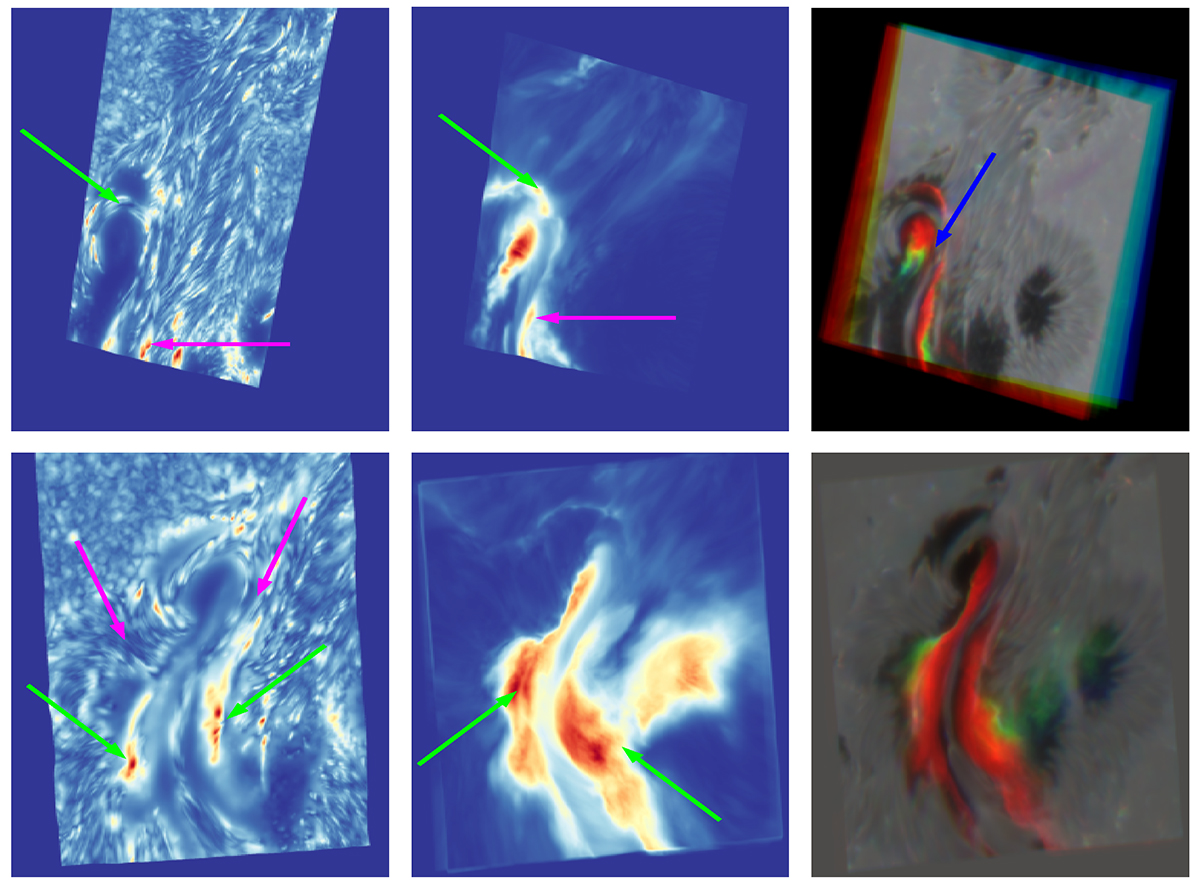
BaSAMs and temporal COCOPLOTs of the X2.2 and X9.3 flares mapping the points of largest change in the FOV. The first column shows a BaSAM of the 4000 Å continuum point over the entire time range. The second column does the same but for the Hα line core. The third image captures the time evolution in the Hα line core, with red being early in the time series, green towards the middle, and blue late.
Current usage metrics show cumulative count of Article Views (full-text article views including HTML views, PDF and ePub downloads, according to the available data) and Abstracts Views on Vision4Press platform.
Data correspond to usage on the plateform after 2015. The current usage metrics is available 48-96 hours after online publication and is updated daily on week days.
Initial download of the metrics may take a while.