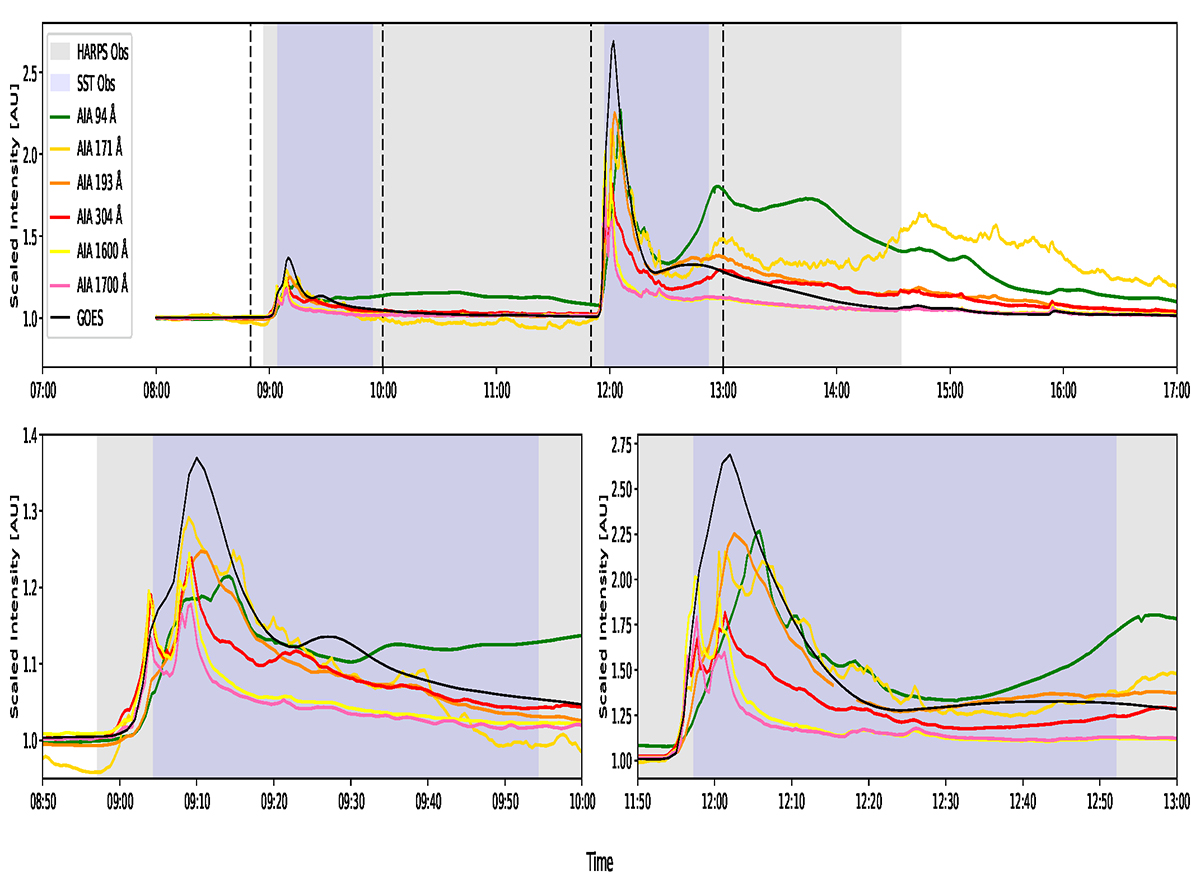
Fig. 1.
Download original image
Comparison between spatially integrated and normalized AIA UV and EUV intensities and the normalized GOES X-ray flux. The area between the dashed lines shows the time window over which the X2.2 and X9.3 flares have been enlarged for the lower two panels. The gray shaded area represents the time during which HARPS-N observed, and the blue shaded area represents when SST was observing.
Current usage metrics show cumulative count of Article Views (full-text article views including HTML views, PDF and ePub downloads, according to the available data) and Abstracts Views on Vision4Press platform.
Data correspond to usage on the plateform after 2015. The current usage metrics is available 48-96 hours after online publication and is updated daily on week days.
Initial download of the metrics may take a while.