Open Access
Fig. 4.
Download original image
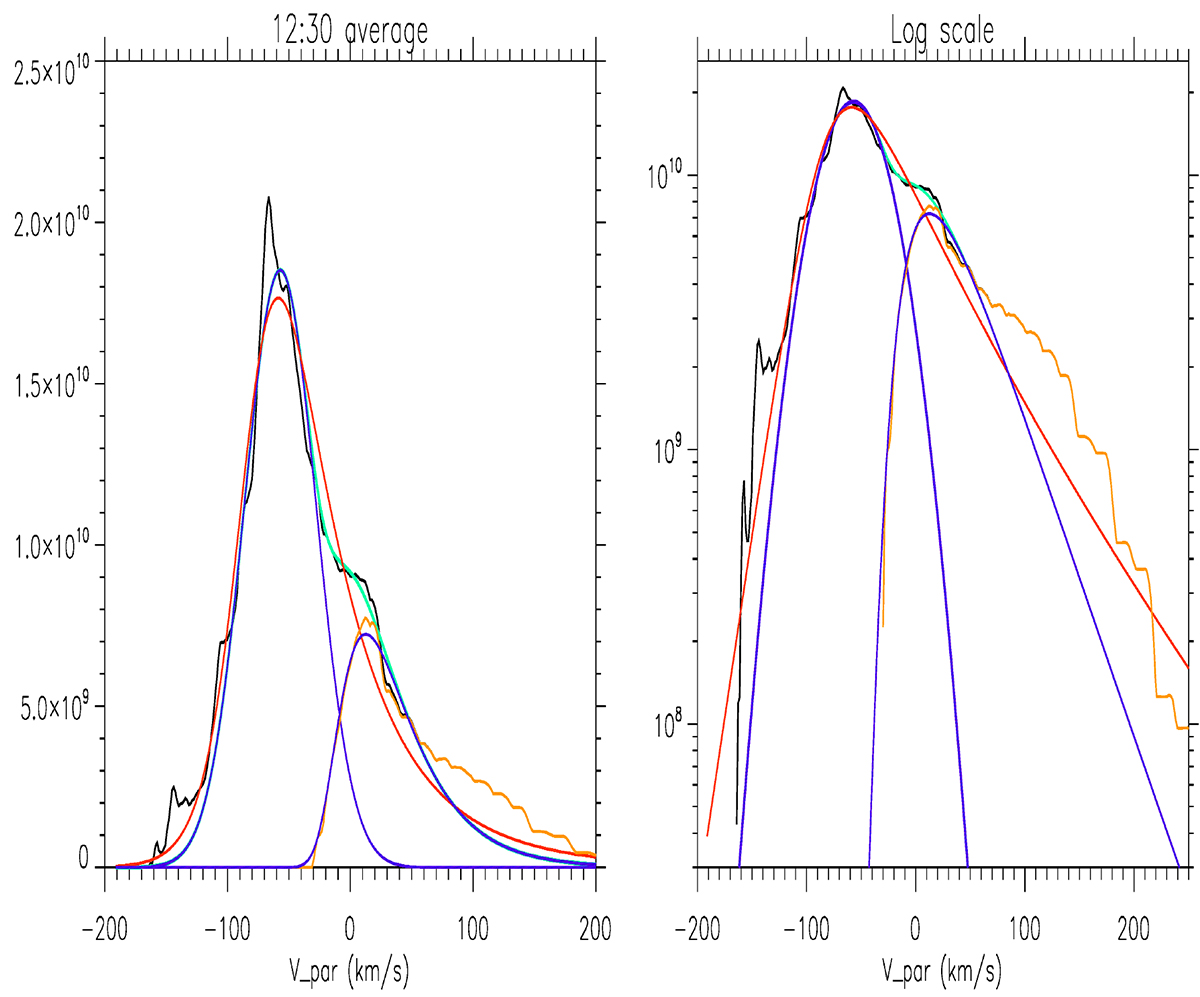
Average distribution at 12:30 (same as in Fig. 3). The Gaussian fit of the core (Mc) and the NIG fit of the beam (NigB) are shown in blue. Mc + NigB, almost undiscernible from the measured distribution, is shown in green. The NIG fit of the whole distribution (NigT) is shown in red.
Current usage metrics show cumulative count of Article Views (full-text article views including HTML views, PDF and ePub downloads, according to the available data) and Abstracts Views on Vision4Press platform.
Data correspond to usage on the plateform after 2015. The current usage metrics is available 48-96 hours after online publication and is updated daily on week days.
Initial download of the metrics may take a while.