Fig. 3.
Download original image
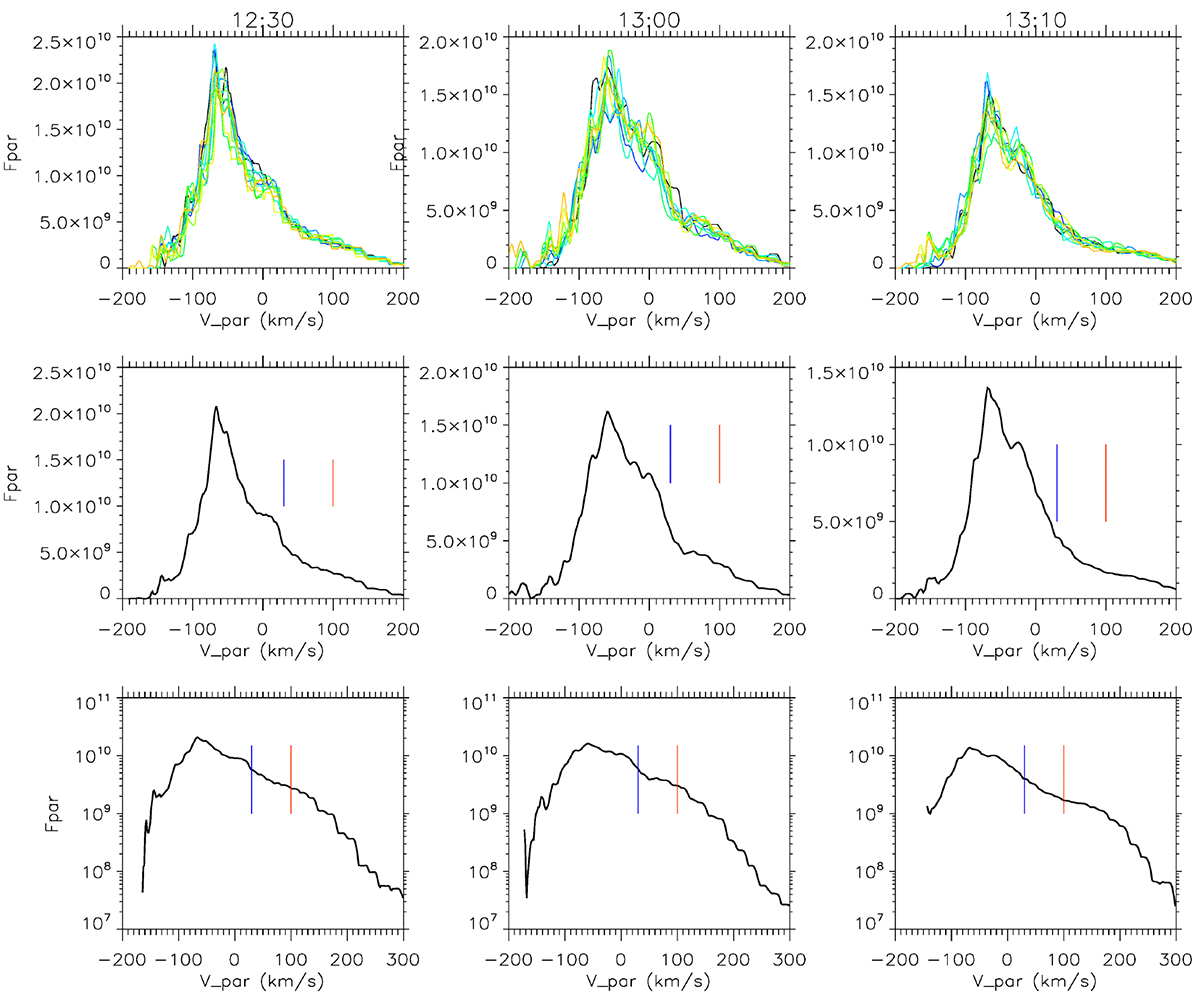
Skewed distributions observed at 12:30, 13:00, and 13:10 (19/03/2022) in SW frame. The top panels show the superposition of ten successive f(v∥) profiles (in s3/km6). The averages are shown below in linear and logarithmic scales. The blue lines indicate VA and the red ones ![]() (see text). The lower value of the logarithmic plots is the one count level.
(see text). The lower value of the logarithmic plots is the one count level.
Current usage metrics show cumulative count of Article Views (full-text article views including HTML views, PDF and ePub downloads, according to the available data) and Abstracts Views on Vision4Press platform.
Data correspond to usage on the plateform after 2015. The current usage metrics is available 48-96 hours after online publication and is updated daily on week days.
Initial download of the metrics may take a while.