Open Access
Fig. A.1
Download original image
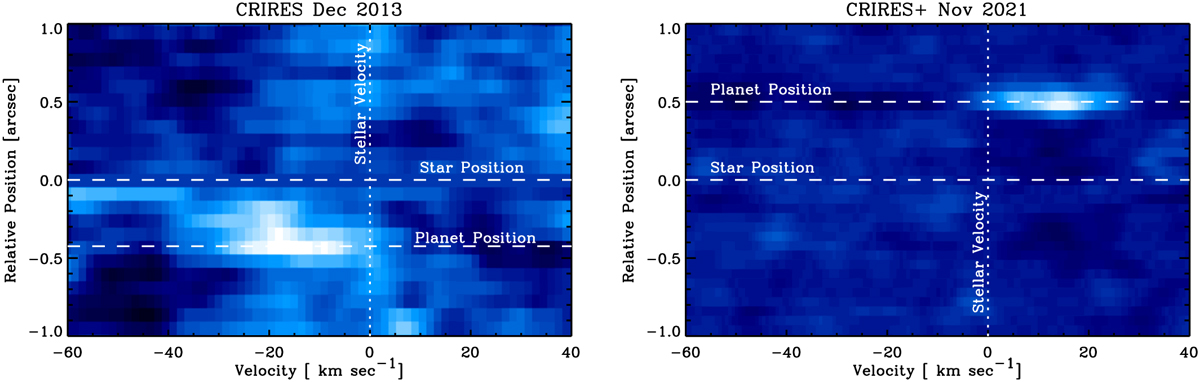
Visual comparison between the cross-correlation signal-to-noise ratio map of β Pic b using the original CRIRES (Snellen et al. 2014) and our new CRIRES+ observations. The relative position along the slit was matched to the convention used in Snellen et al. (2014).
Current usage metrics show cumulative count of Article Views (full-text article views including HTML views, PDF and ePub downloads, according to the available data) and Abstracts Views on Vision4Press platform.
Data correspond to usage on the plateform after 2015. The current usage metrics is available 48-96 hours after online publication and is updated daily on week days.
Initial download of the metrics may take a while.