Fig. 7
Download original image
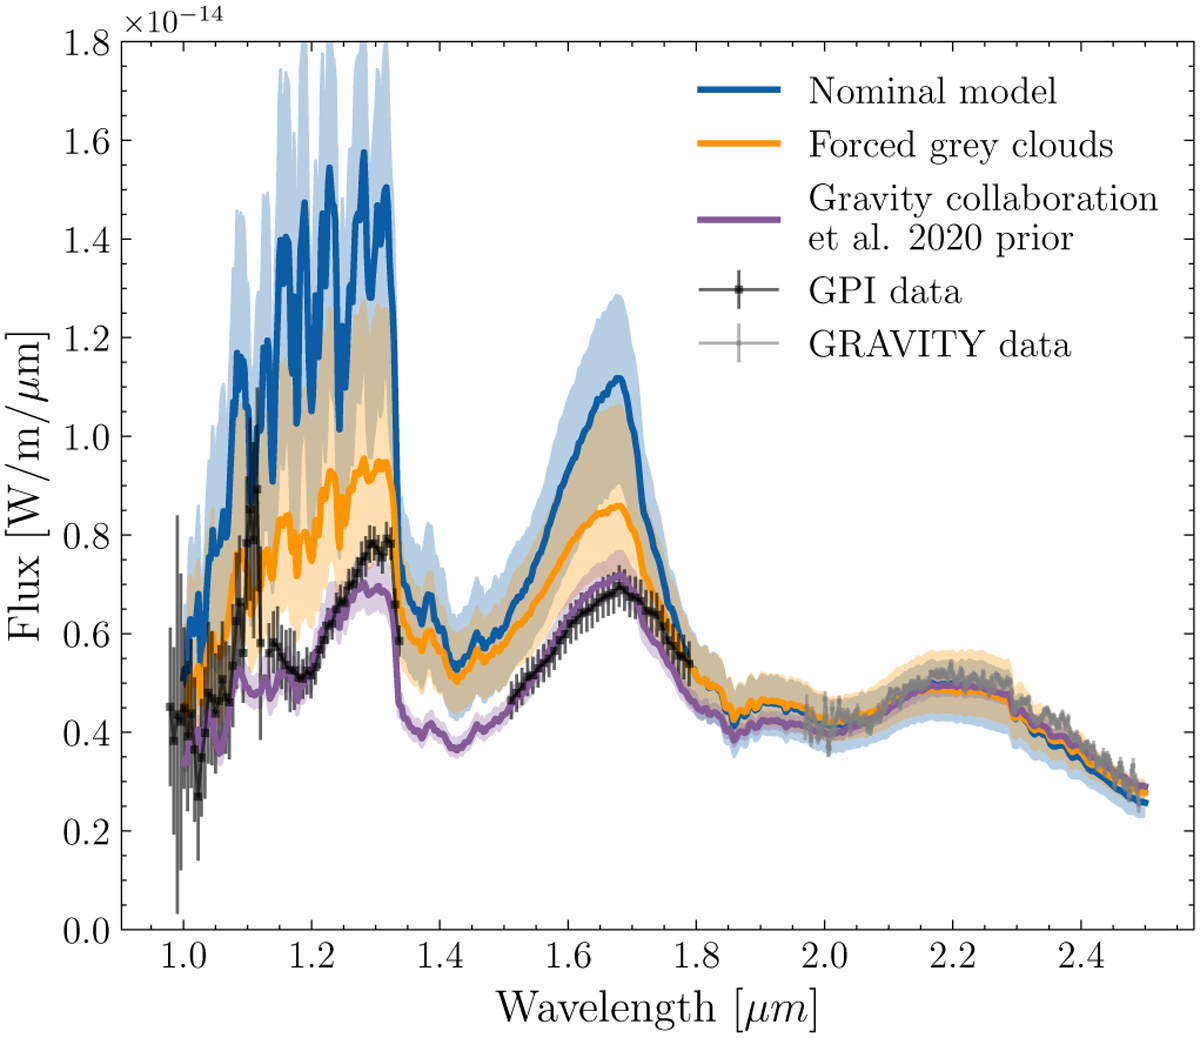
Comparison of the spectral energy distributions of our retrieved models compared to the low-resolution GPI data from Chilcote et al. (2017) and GRAVITY data from GRAVITY Collaboration (2020). Since we do not retrieve radius, the flux of our models is scaled such that it matches the GPI flux in the K-band. The solid line shows the median value and the colored region shows the 16th and 84th percentiles.
Current usage metrics show cumulative count of Article Views (full-text article views including HTML views, PDF and ePub downloads, according to the available data) and Abstracts Views on Vision4Press platform.
Data correspond to usage on the plateform after 2015. The current usage metrics is available 48-96 hours after online publication and is updated daily on week days.
Initial download of the metrics may take a while.