Fig. 6
Download original image
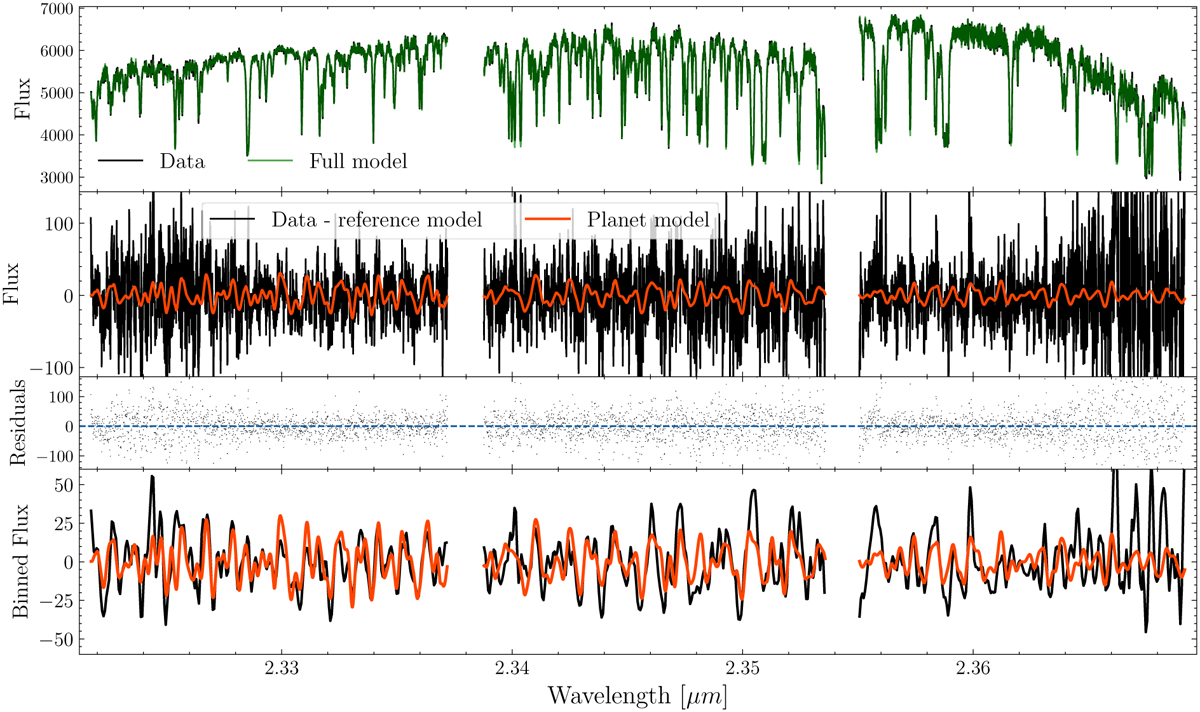
CRIRES+ data from one of the spectral orders along with the fitted model. Top panel shows the total extracted flux at the location of the planet with the full fitted model including star, planet, and systematics. The second panel shows the data after subtracting the stellar and systematic components, along with the best-fitting planet model. The third panel shows the residuals of this fit. Finally, the bottom panel shows the same as the second panel but then smoothed to a spectral resolution of 15 000 to show the broad planet features more clearly.
Current usage metrics show cumulative count of Article Views (full-text article views including HTML views, PDF and ePub downloads, according to the available data) and Abstracts Views on Vision4Press platform.
Data correspond to usage on the plateform after 2015. The current usage metrics is available 48-96 hours after online publication and is updated daily on week days.
Initial download of the metrics may take a while.