Fig. 3
Download original image
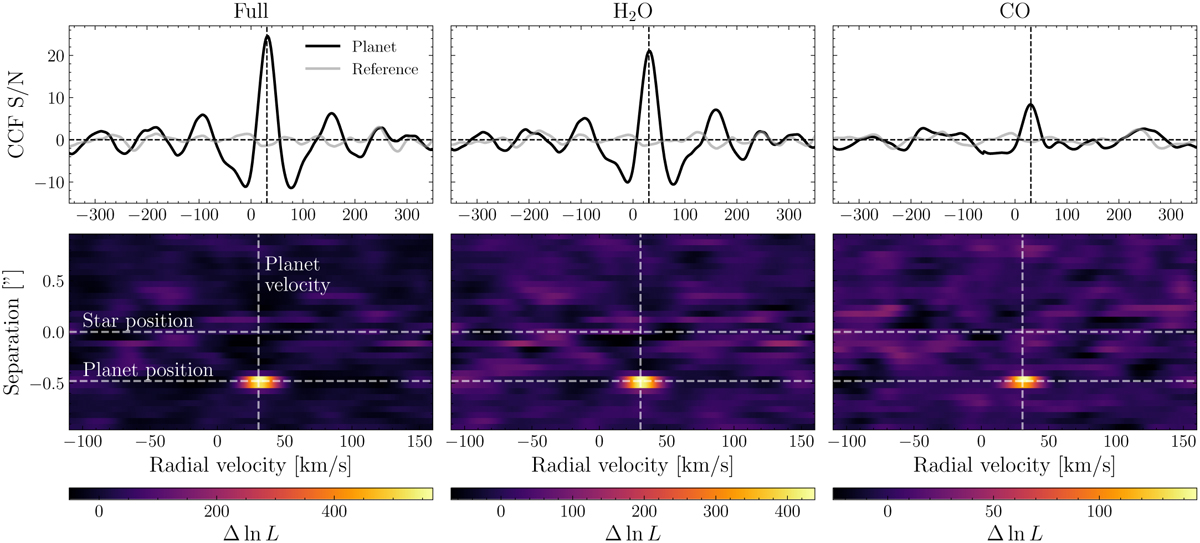
Detection of the planet using model templates of the full planet, H2O and CO using cross-correlation (top row) and the likelihood ratio (bottom row). The radial velocity is shown here in the barycentric restframe. In the top panel we also show the cross-correlation value for a reference spectrum, which was taken at the same separation on the other side of the star. In the bottom panels we indicate the location of the star and the planet and the expected velocity of the planet.
Current usage metrics show cumulative count of Article Views (full-text article views including HTML views, PDF and ePub downloads, according to the available data) and Abstracts Views on Vision4Press platform.
Data correspond to usage on the plateform after 2015. The current usage metrics is available 48-96 hours after online publication and is updated daily on week days.
Initial download of the metrics may take a while.