Fig. 1
Download original image
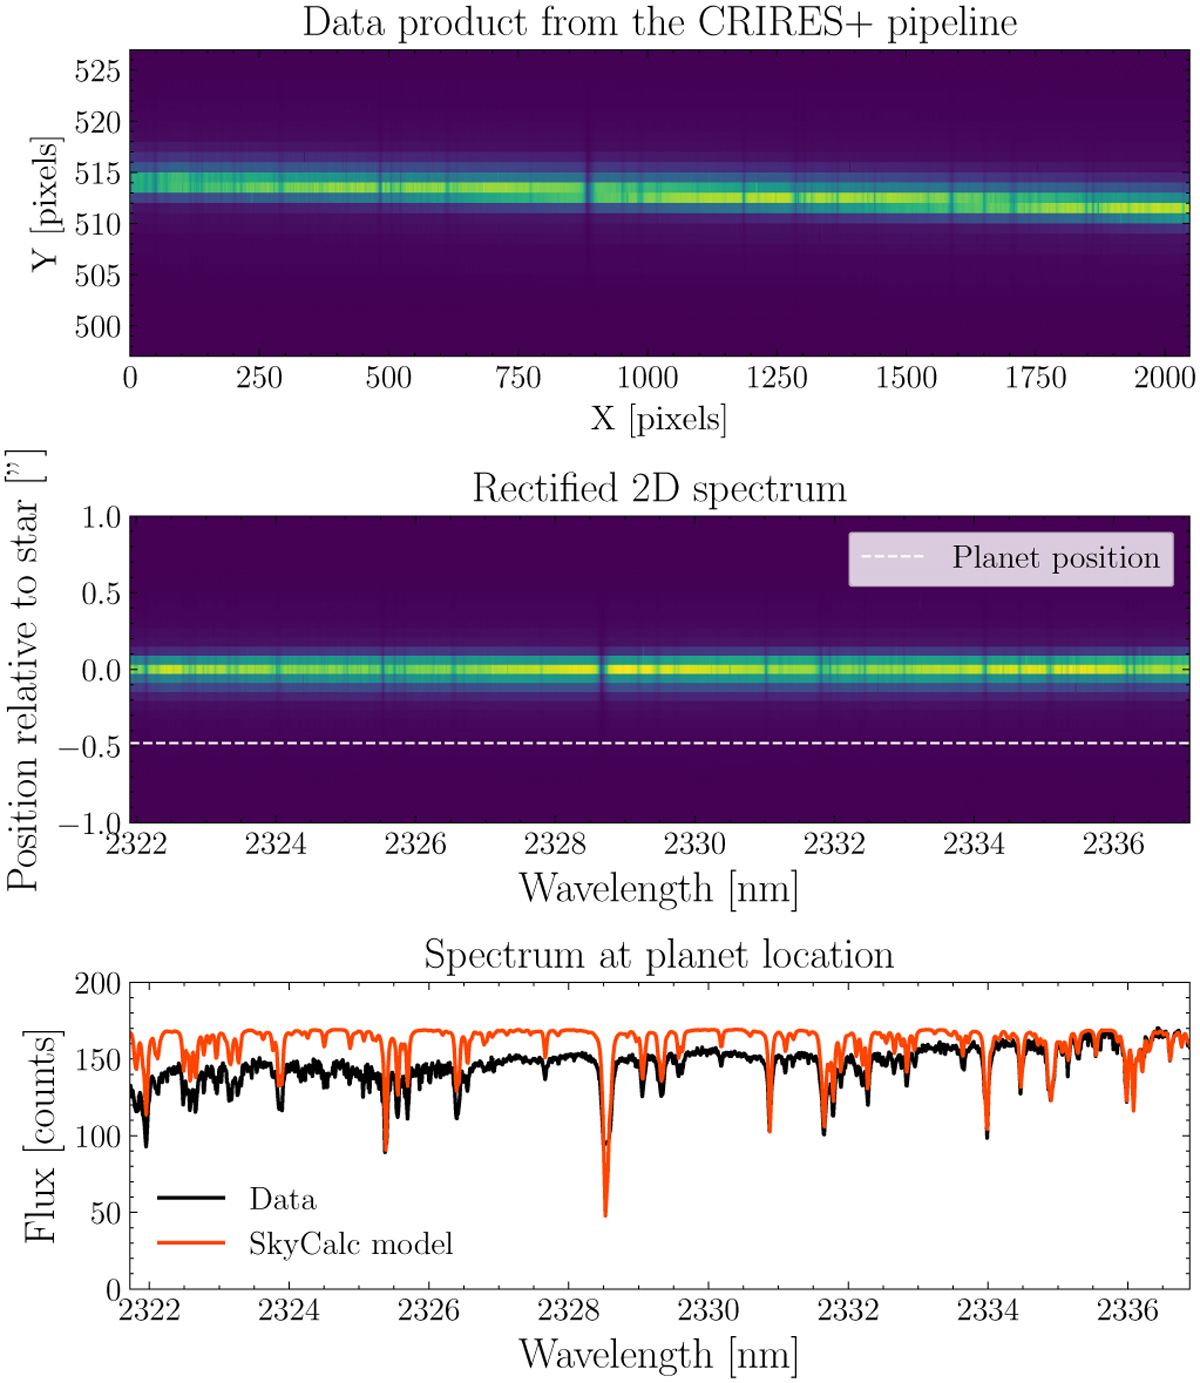
Visualization of the data extraction pipeline. Top row shows the product of the obs_nodding recipe from the ESO CRIRES+ data reduction pipeline. The middle row shows the rectified 2D spectrum corrected for the slit tilt and curvature using pycrires and the bottom row shows the spectrum at the location of the planet, plotted together with a telluric model generated with SkyCalc.
Current usage metrics show cumulative count of Article Views (full-text article views including HTML views, PDF and ePub downloads, according to the available data) and Abstracts Views on Vision4Press platform.
Data correspond to usage on the plateform after 2015. The current usage metrics is available 48-96 hours after online publication and is updated daily on week days.
Initial download of the metrics may take a while.