Fig. 7
Download original image
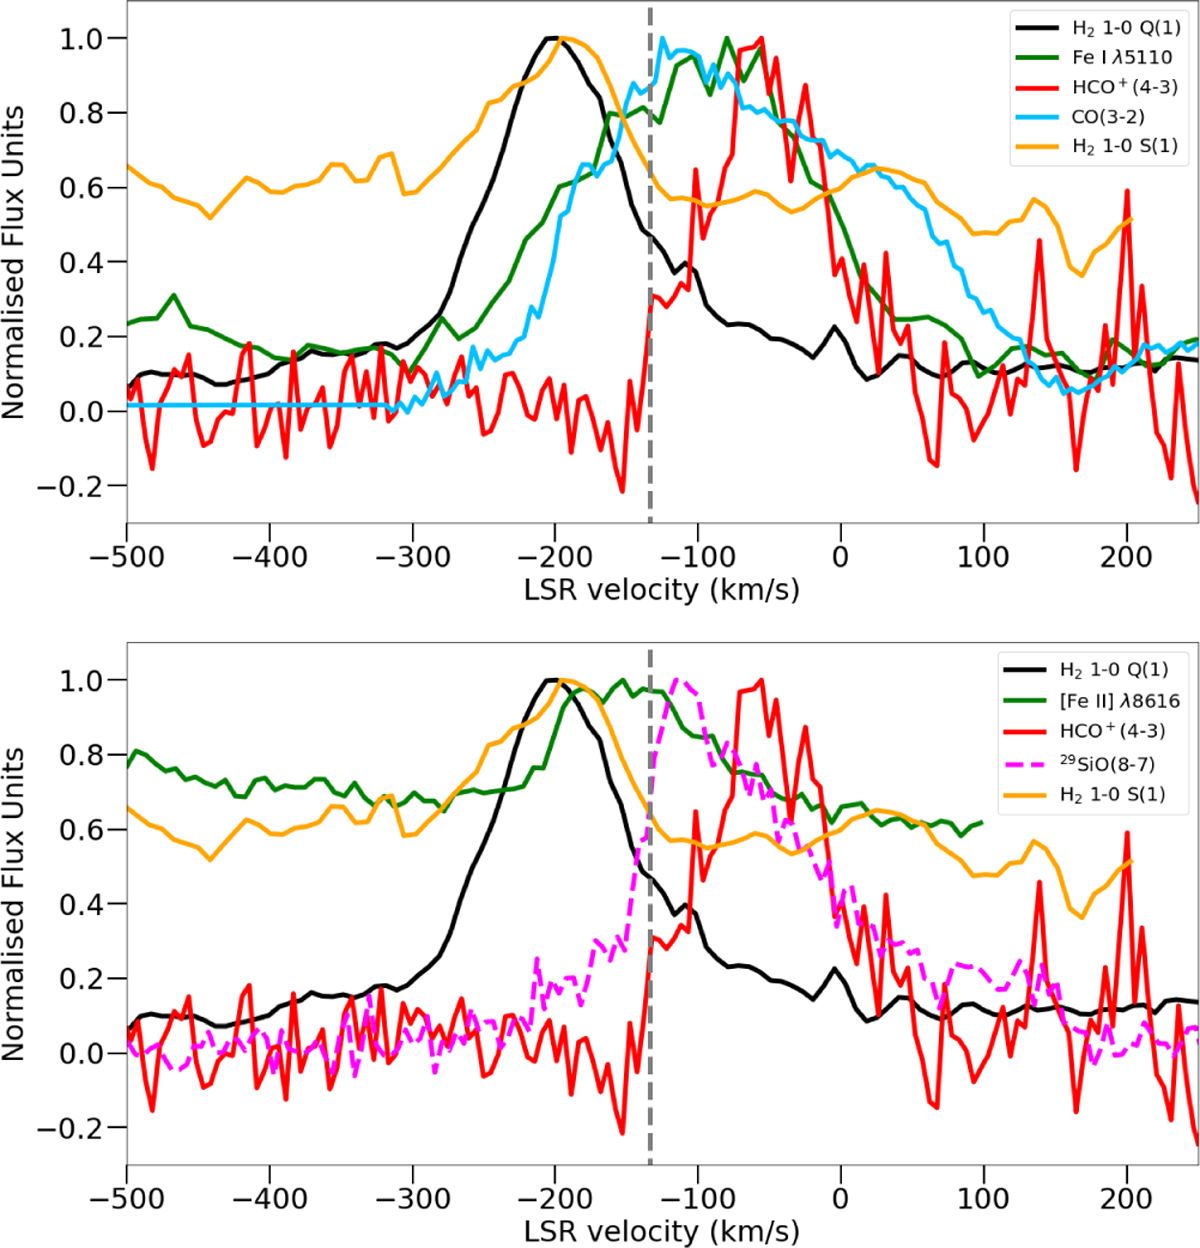
Velocity profiles of HCO+ (4–3), H2 1–0 S(1) and H2 1–0 Q(1), normalised or otherwise scaled and shifted (both panels). The top panel also shows the CO (3–2) and Fe I λ5110 profiles, whilst the bottom panel shows [Fe II] λ8616 and 29SiO (8–7). The grey dashed line represents the average peak velocity of the atomic emission detected in X-shooter at−134 km s−1.
Current usage metrics show cumulative count of Article Views (full-text article views including HTML views, PDF and ePub downloads, according to the available data) and Abstracts Views on Vision4Press platform.
Data correspond to usage on the plateform after 2015. The current usage metrics is available 48-96 hours after online publication and is updated daily on week days.
Initial download of the metrics may take a while.