Open Access
Fig. 5
Download original image
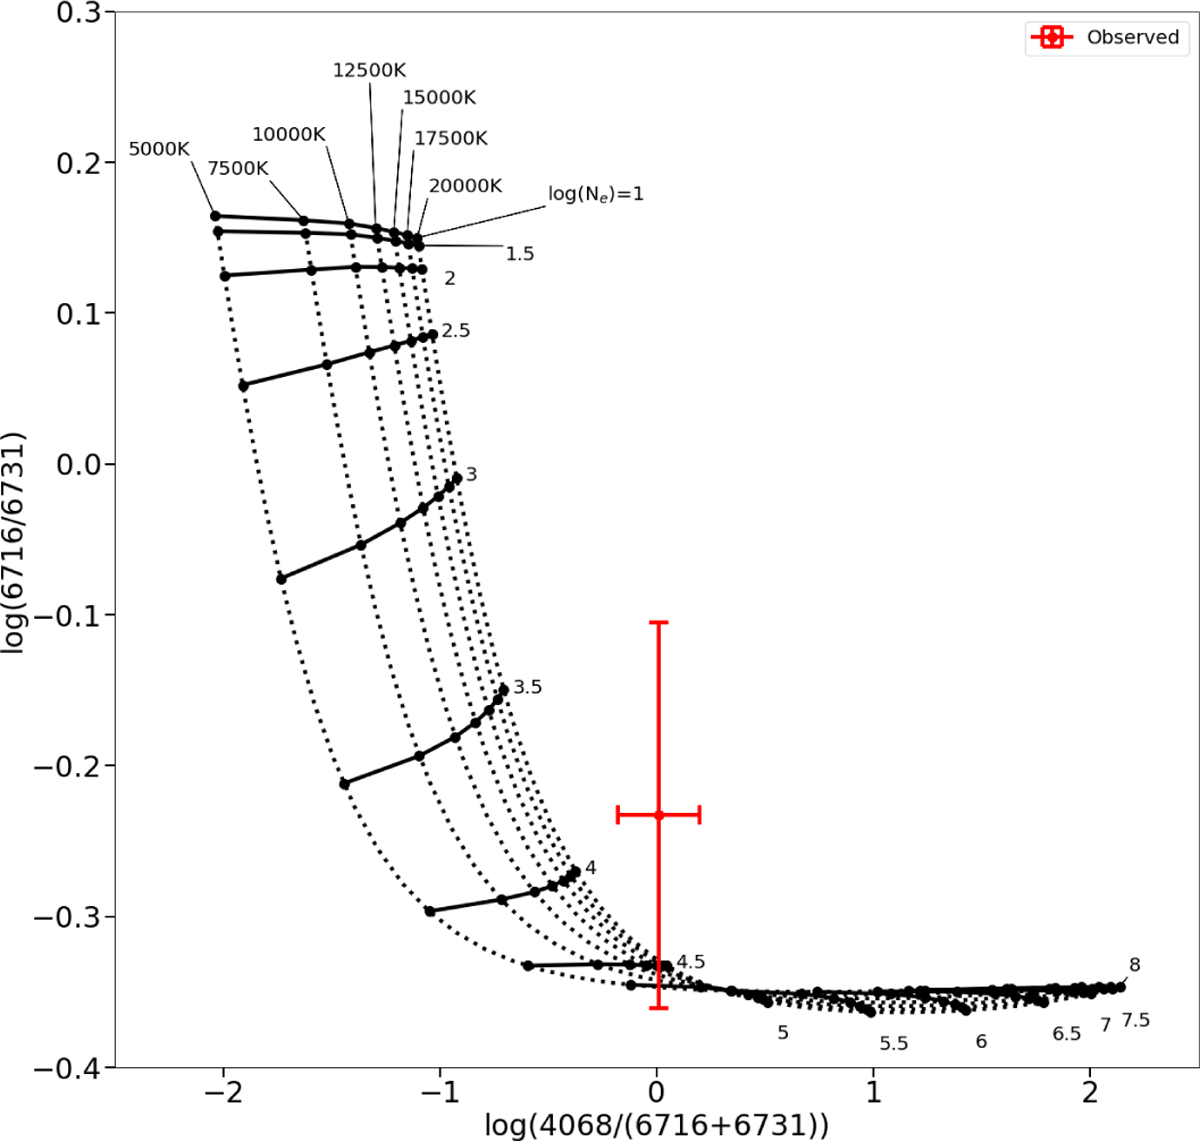
Diagnostic grid of [S II] ![]() vs.
vs. ![]() . Solid lines represent lines of constant temperature and dotted lines represent lines of constant density. Larger black dots show the intersecting points between solidand dotted lines, and the red point and errorbars indicate the location of the observed quantity for both line ratios.
. Solid lines represent lines of constant temperature and dotted lines represent lines of constant density. Larger black dots show the intersecting points between solidand dotted lines, and the red point and errorbars indicate the location of the observed quantity for both line ratios.
Current usage metrics show cumulative count of Article Views (full-text article views including HTML views, PDF and ePub downloads, according to the available data) and Abstracts Views on Vision4Press platform.
Data correspond to usage on the plateform after 2015. The current usage metrics is available 48-96 hours after online publication and is updated daily on week days.
Initial download of the metrics may take a while.