Open Access
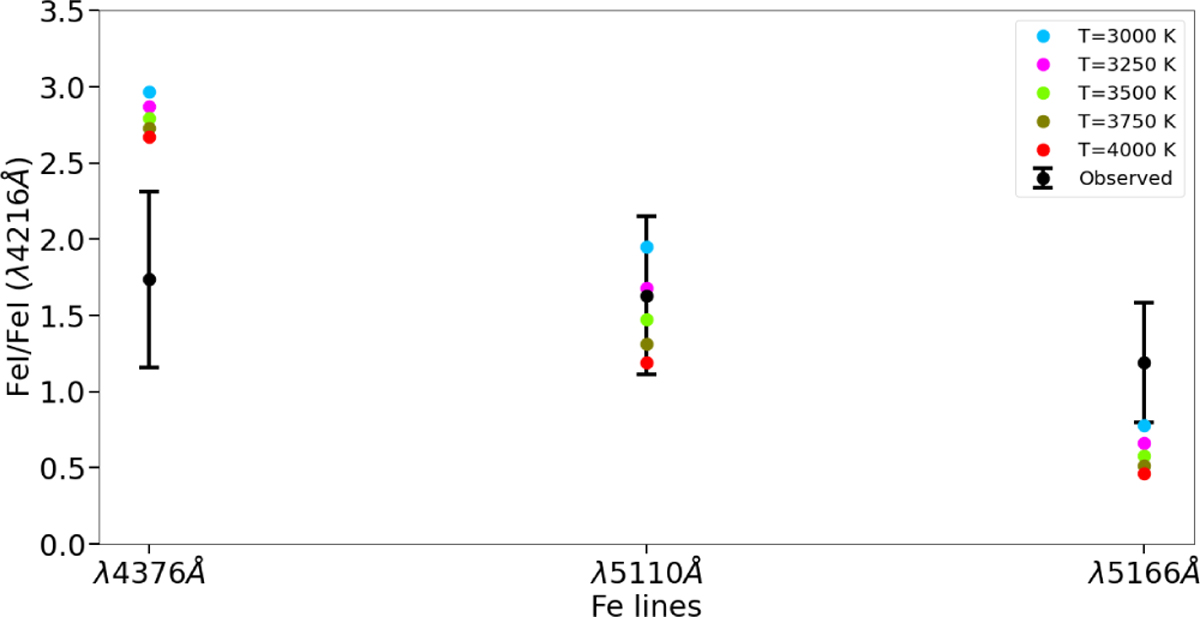
Fig. 4
Download original image
NIST-simulated intensities of the Fe I lines at 4375, 5110 and 5166 Å relative to the Fe I λ4216. The simulations were calculated at temperatures between 3000 and 4000 K, at intervals of 250 K. The χ2 test showed that the best fitting temperature was 3500 K (green points). The black points indicate the observed line ratios.
Current usage metrics show cumulative count of Article Views (full-text article views including HTML views, PDF and ePub downloads, according to the available data) and Abstracts Views on Vision4Press platform.
Data correspond to usage on the plateform after 2015. The current usage metrics is available 48-96 hours after online publication and is updated daily on week days.
Initial download of the metrics may take a while.