Open Access
Fig. 10
Download original image
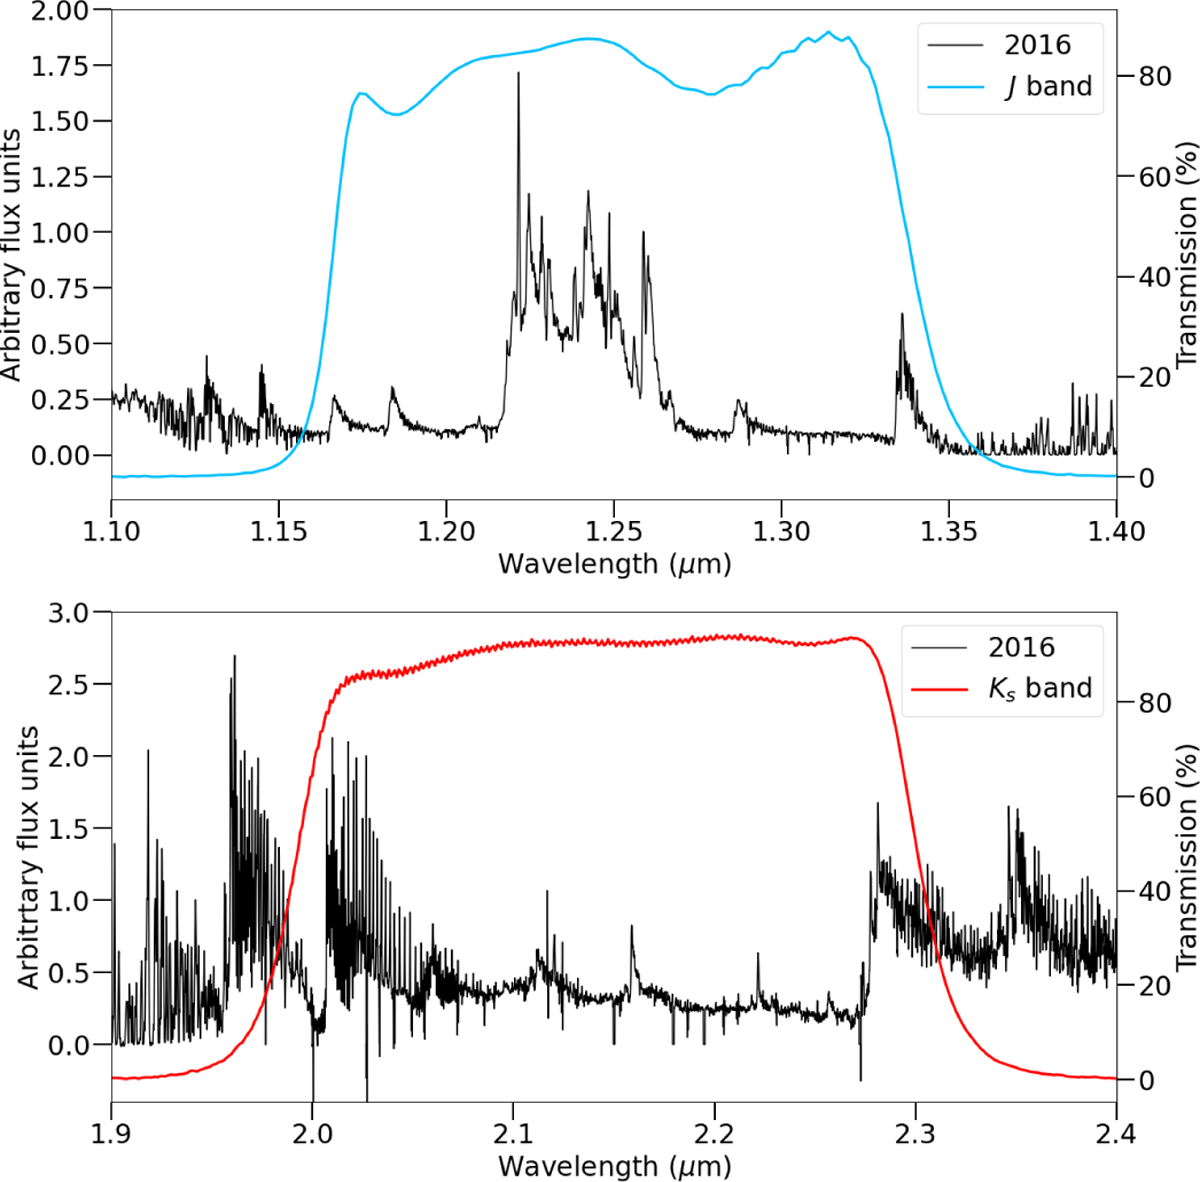
X-shooter spectra between 11300 and 14100 Å from 2016 (black) with VVV transmission curves overplotted. The top panel shows the transmission curve of the J band (blue), and the bottom panel shows the transmission curve of the Ks band (red).
Current usage metrics show cumulative count of Article Views (full-text article views including HTML views, PDF and ePub downloads, according to the available data) and Abstracts Views on Vision4Press platform.
Data correspond to usage on the plateform after 2015. The current usage metrics is available 48-96 hours after online publication and is updated daily on week days.
Initial download of the metrics may take a while.