Fig. 1
Download original image
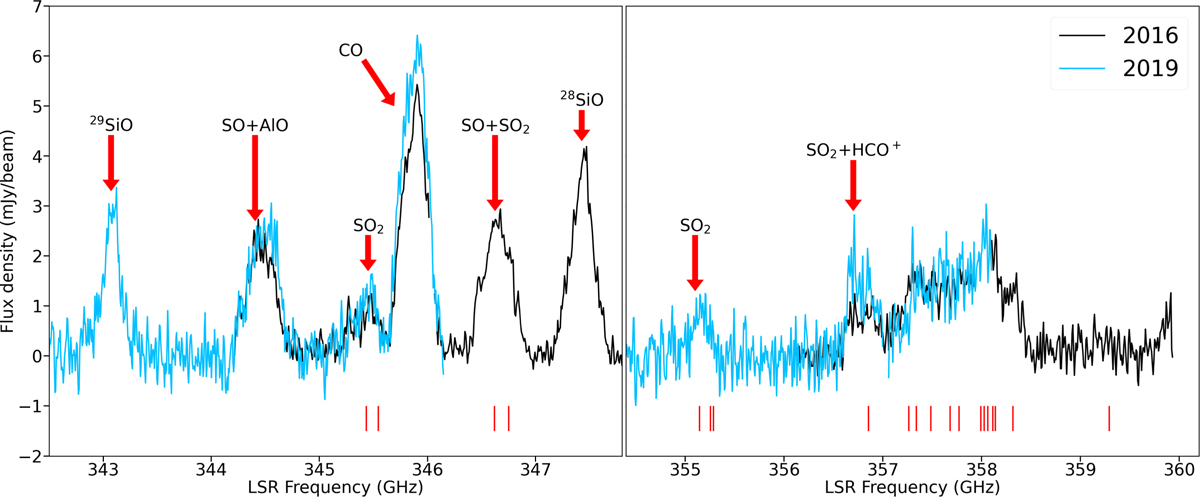
ALMA band 7 spectra of V1309 Sco. The reference frame is LSR. Black shows the 2016 spectrum, and blue shows the 2019 spectrum. The key lines are indicated by the labels. Red vertical lines indicate the position of the multiple identified SO2 lines shifted to the observed positions. The 2019 spectrum was extracted from data smoothed to the same beam size as the 2016 data. Both spectra represent the entire source. Both spectra are smoothed.
Current usage metrics show cumulative count of Article Views (full-text article views including HTML views, PDF and ePub downloads, according to the available data) and Abstracts Views on Vision4Press platform.
Data correspond to usage on the plateform after 2015. The current usage metrics is available 48-96 hours after online publication and is updated daily on week days.
Initial download of the metrics may take a while.