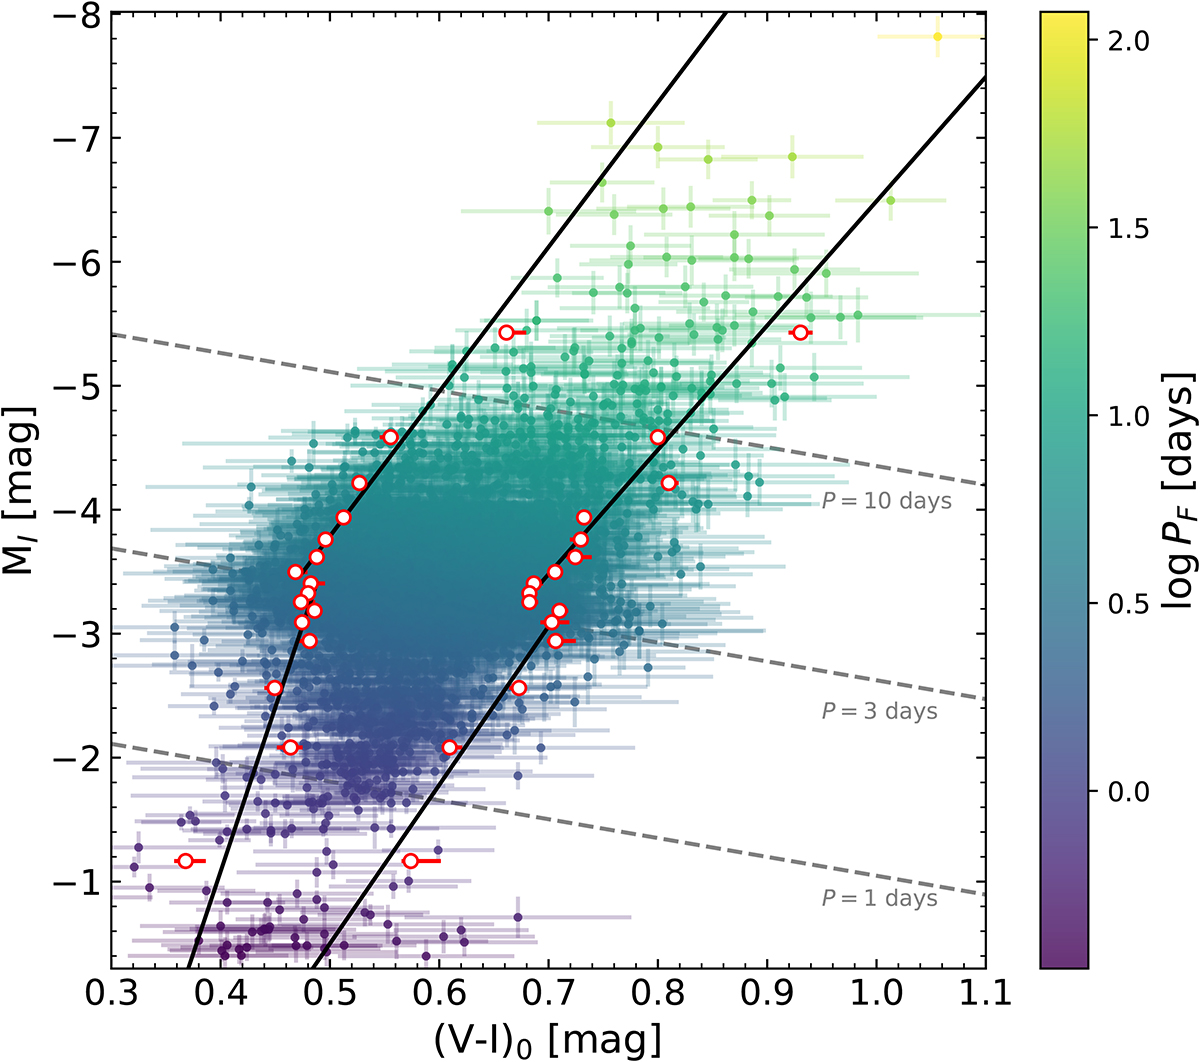
Fig. 5.
Download original image
CMD of F and 1O LMC Cepheids. The boundaries of our empirical IS are shown as red circles. Fits for the upper and lower part of the red and blue edges are shown as black solid lines. Periods for these stars are shown with a color gradient. For 1O Cepheids, periods were fundamentalized. Dashed lines of constant periods are overplotted. In most cases, error bars are smaller than the size of the points.
Current usage metrics show cumulative count of Article Views (full-text article views including HTML views, PDF and ePub downloads, according to the available data) and Abstracts Views on Vision4Press platform.
Data correspond to usage on the plateform after 2015. The current usage metrics is available 48-96 hours after online publication and is updated daily on week days.
Initial download of the metrics may take a while.