Fig. 3.
Download original image
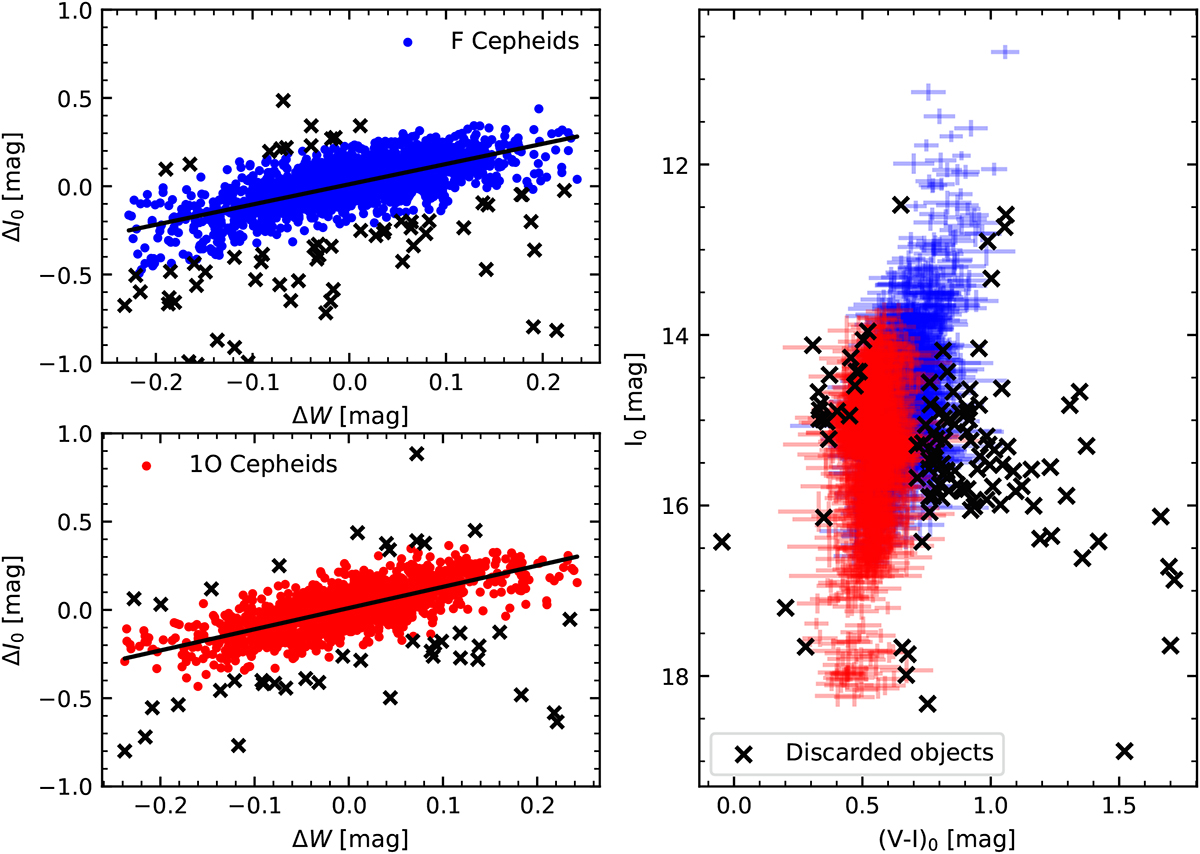
Diagram of magnitude residuals of I-band P–L relation, ΔI0, against the corresponding residuals of the P–W relation, ΔW, for F (upper left panel) and 1O (lower left panel) LMC Cepheids. Objects that deviate more than three sigma from this relation are marked with black crosses. These objects are also shown in a CMD of F (blue crosses) and 1O (red crosses) LMC Cepheids in the right panel.
Current usage metrics show cumulative count of Article Views (full-text article views including HTML views, PDF and ePub downloads, according to the available data) and Abstracts Views on Vision4Press platform.
Data correspond to usage on the plateform after 2015. The current usage metrics is available 48-96 hours after online publication and is updated daily on week days.
Initial download of the metrics may take a while.