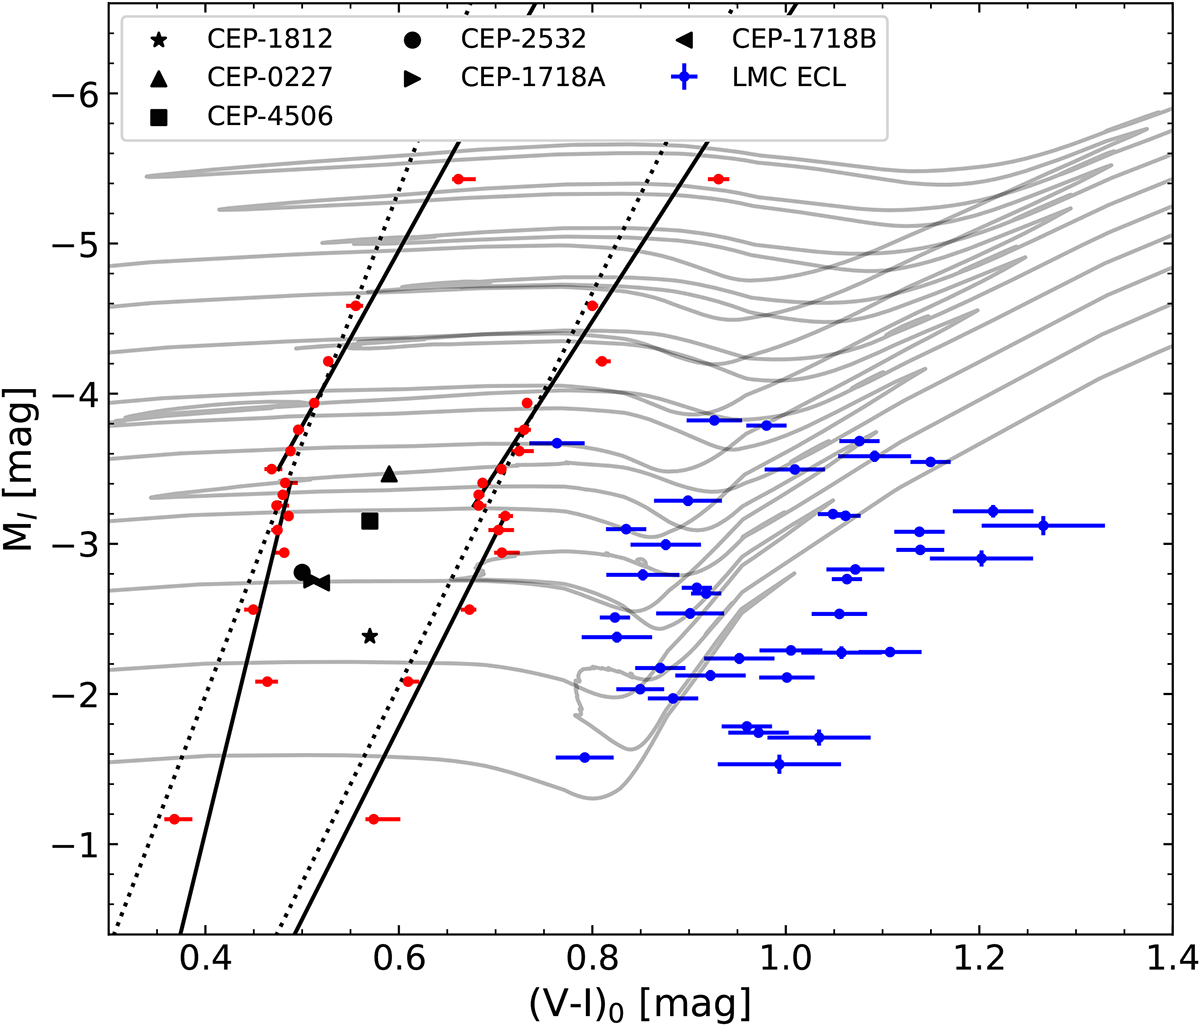
Fig. 10.
Download original image
CMD comparing our empirical IS (red points) with LMC eclipsing binary stars (black points). Data for well-documented Cepheids in eclipsing binaries are displayed as black symbols. Fits for the blue and red edges of the IS are shown as solid lines (considering a break) and dotted lines (without a break). In addition, evolutionary tracks of 3 to 7 M⊙ in steps of 0.5 M⊙ are presented as gray lines.
Current usage metrics show cumulative count of Article Views (full-text article views including HTML views, PDF and ePub downloads, according to the available data) and Abstracts Views on Vision4Press platform.
Data correspond to usage on the plateform after 2015. The current usage metrics is available 48-96 hours after online publication and is updated daily on week days.
Initial download of the metrics may take a while.