Fig. 3

Download original image
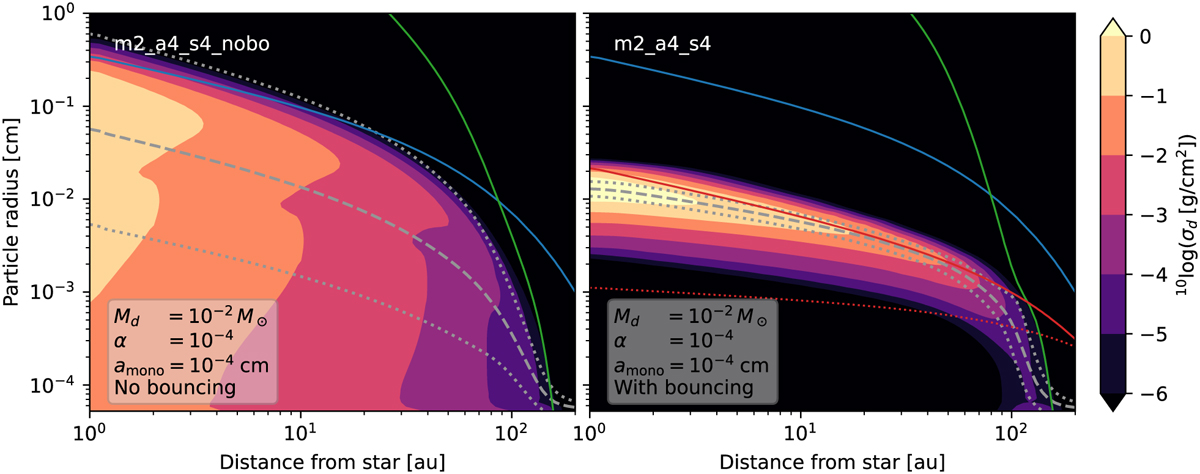
Dust size distribution for the fiducial model without the bouncing barrier m2_a4_s4_nobo (left) and with bouncing barrier m2_a4_s4 (right). The blue line is the fragmentation barrier, the green line is the radial drift barrier, and the red line is the bouncing barrier, all computed assuming turbulence to be the dominant driver of relative velocities. The dotted red line is the bouncing barrier if Eqs. (13), (14) are not taken into account. The dashed gray line is the mean grain size, and the dotted lines are plus or minus one standard deviation in log space (see Appendix A.1). The color scale denotes the surface density of the dust σd(r, m) = m Σd(r, m) in units of grams per square cm2 per ln(m).
Current usage metrics show cumulative count of Article Views (full-text article views including HTML views, PDF and ePub downloads, according to the available data) and Abstracts Views on Vision4Press platform.
Data correspond to usage on the plateform after 2015. The current usage metrics is available 48-96 hours after online publication and is updated daily on week days.
Initial download of the metrics may take a while.


