Fig. 15
Download original image
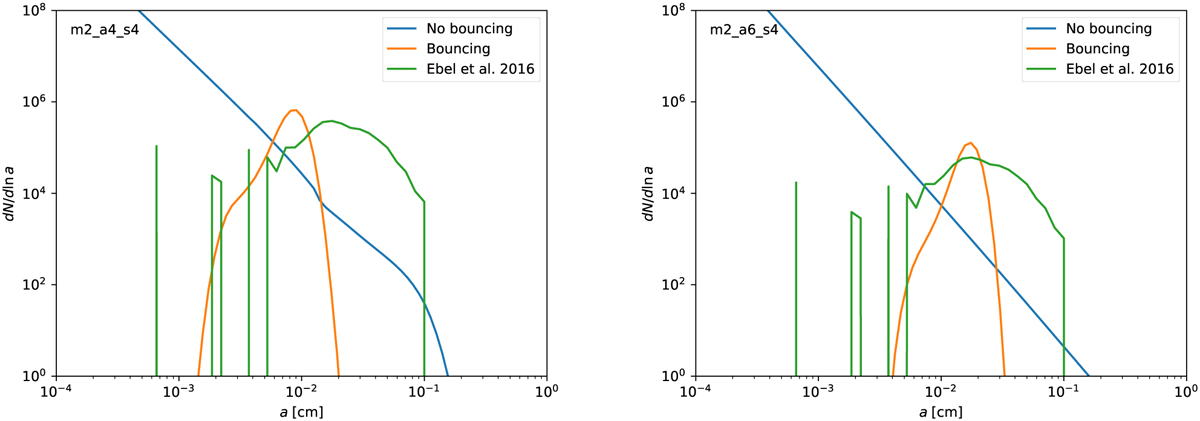
Logarithmic size distribution (a dN/da = dN/ ln a) of dust aggregates at r = 2.9 au in the protoplanetary disk. Left: fiducial model m2_a4_s4. Right: model m2_a6_s4, which is like the fiducial model but with a 100-times lower α value. The blue and orange curves are for the cases without a bouncing barrier and with a bouncing barrier, respectively, and they have been normalized such that ![]() is the number of aggregates per square centimetre of the disk. The Ebel results are the chondrule radius distribution inferred from thin slices of Allende, shown with the green curve of their figure 7 (we note that we plot against the radius, while Ebel et al. (2016) plotted against the 2-log of the diameter). The normalization of the Ebel curve has been adjusted so that it equals that of the two other curves. We also note that due to the limited sample size, the renormalized Ebel curve is noise limited at about dN/d ln a ≃ 104.
is the number of aggregates per square centimetre of the disk. The Ebel results are the chondrule radius distribution inferred from thin slices of Allende, shown with the green curve of their figure 7 (we note that we plot against the radius, while Ebel et al. (2016) plotted against the 2-log of the diameter). The normalization of the Ebel curve has been adjusted so that it equals that of the two other curves. We also note that due to the limited sample size, the renormalized Ebel curve is noise limited at about dN/d ln a ≃ 104.
Current usage metrics show cumulative count of Article Views (full-text article views including HTML views, PDF and ePub downloads, according to the available data) and Abstracts Views on Vision4Press platform.
Data correspond to usage on the plateform after 2015. The current usage metrics is available 48-96 hours after online publication and is updated daily on week days.
Initial download of the metrics may take a while.