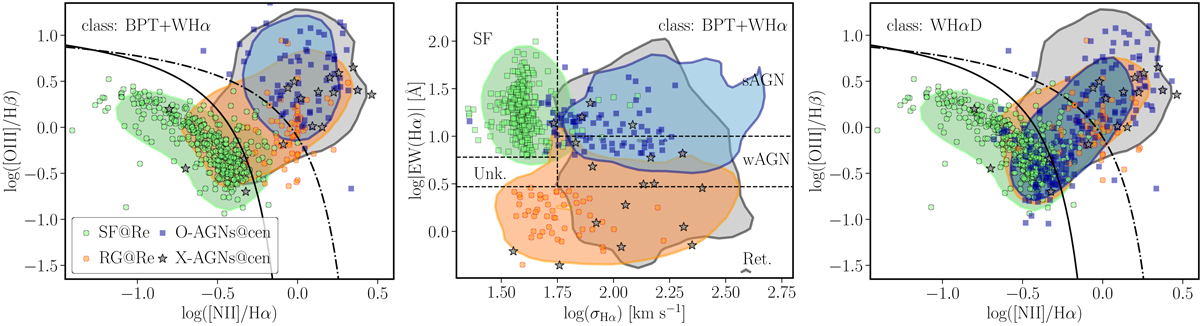
Fig. 1.
Download original image
Comparison between the classical BPT and the new proposed diagnostic diagram for integrated properties. Left panel: Classical BPT diagram (Baldwin et al. 1981), showing the distribution of [O III]/Hβ line ratio as a function of [N II]/Hα ratio. It includes four sub-samples of objects whose ionization has been classified according to this diagram together together with EW(Hα), following Sánchez et al. (2021): (i) star-forming galaxies (SF, green), (ii) retired galaxies (RG, orange), (iii) optically selected AGNs (O-AGNs, blue), and (iv) X-ray selected AGNs (X-AGNs, black stars). Solid symbols correspond to data extracted from the eCALIFA sample, with the X-AGNs being extracted from Osorio-Clavijo et al. (2023). The shaded regions correspond to data extracted from the MaNGA sample (SF, RG, and O-AGNs) and from Agostino & Salim (2019) (X-AGNs), showing the area encircling 90% of the objects in each case. The region at which the ionization was measured is indicated in the legend: central aperture (cen) or at the effective radius (Re). Solid and dot-dashed lines correspond to the classical demarcations lines proposed by Kauffmann et al. (2003) and Kewley et al. (2001) to distinguish between the different ionizing sources. Middle panel: New proposed diagnostic diagram (WHaD) showing the distribution of the EW(Hα) (or WHα) as a function of the Hα velocity dispersion for the same sub-samples of objects included in the previous panel, using the same nomenclature. It is clearly appreciated that the different ionizing sources are well separated in this new diagram. Dashed lines correspond to the proposed demarcation lines to separate between different dominant ionizing sources, with the corresponding sources indicated. Right-panel: Distribution in the BPT diagram shown in the first panel of the eCALIFA (solid symbols) and MaNGA (shadded regions) galaxies classified according to the location of their ionization in the WHaD diagram, measured at the same two locations indicated adopted for the values shown in the first panel. The location of the X-ray selected AGNs has been included for completness.
Current usage metrics show cumulative count of Article Views (full-text article views including HTML views, PDF and ePub downloads, according to the available data) and Abstracts Views on Vision4Press platform.
Data correspond to usage on the plateform after 2015. The current usage metrics is available 48-96 hours after online publication and is updated daily on week days.
Initial download of the metrics may take a while.