Fig. 7
Download original image
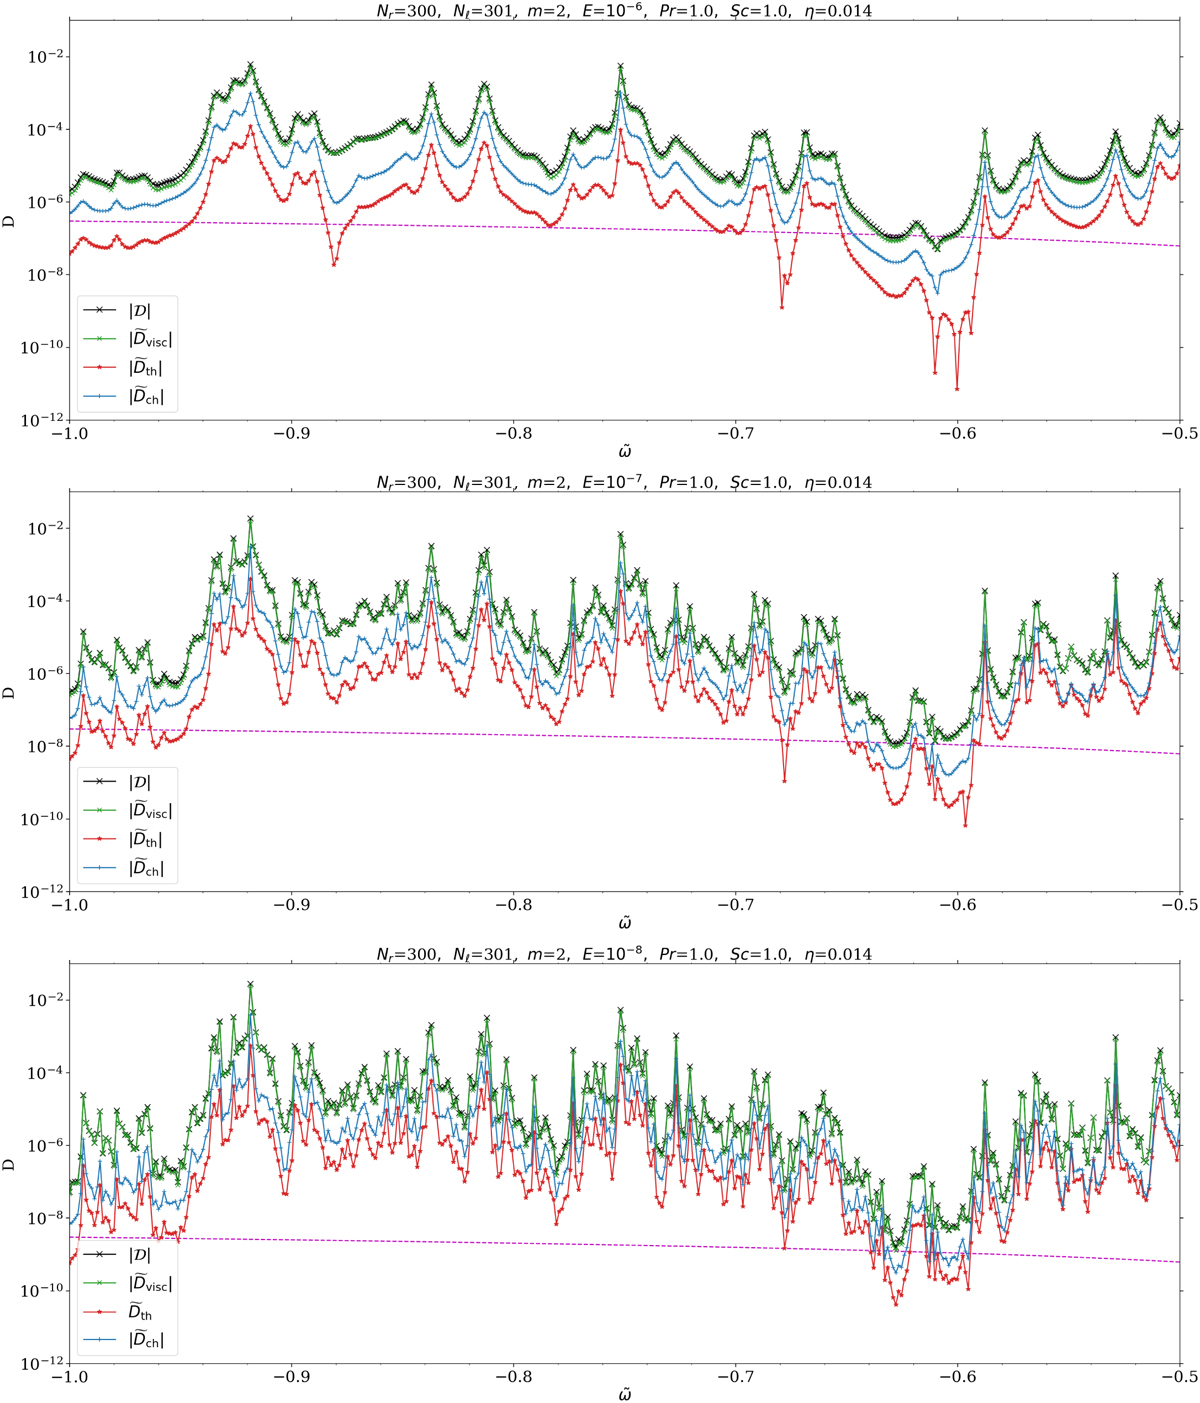
Dissipation spectra for m = 2, Pr = Sc = 1, and E = 10−6 (top), E = 10−7 (middle), and E = 10−8 (bottom) with a spatial resolution (Nr, Nℓ) = (300, 301). The total dissipation is represented by black crosses, and its viscous, thermal, and molecular contributions are represented by green points, red stars, and blue plus signs, respectively. The magenta dashed line indicates the viscous (total) dissipation in the case of a purely convective interior ![]() .
.
Current usage metrics show cumulative count of Article Views (full-text article views including HTML views, PDF and ePub downloads, according to the available data) and Abstracts Views on Vision4Press platform.
Data correspond to usage on the plateform after 2015. The current usage metrics is available 48-96 hours after online publication and is updated daily on week days.
Initial download of the metrics may take a while.