Fig. 5.
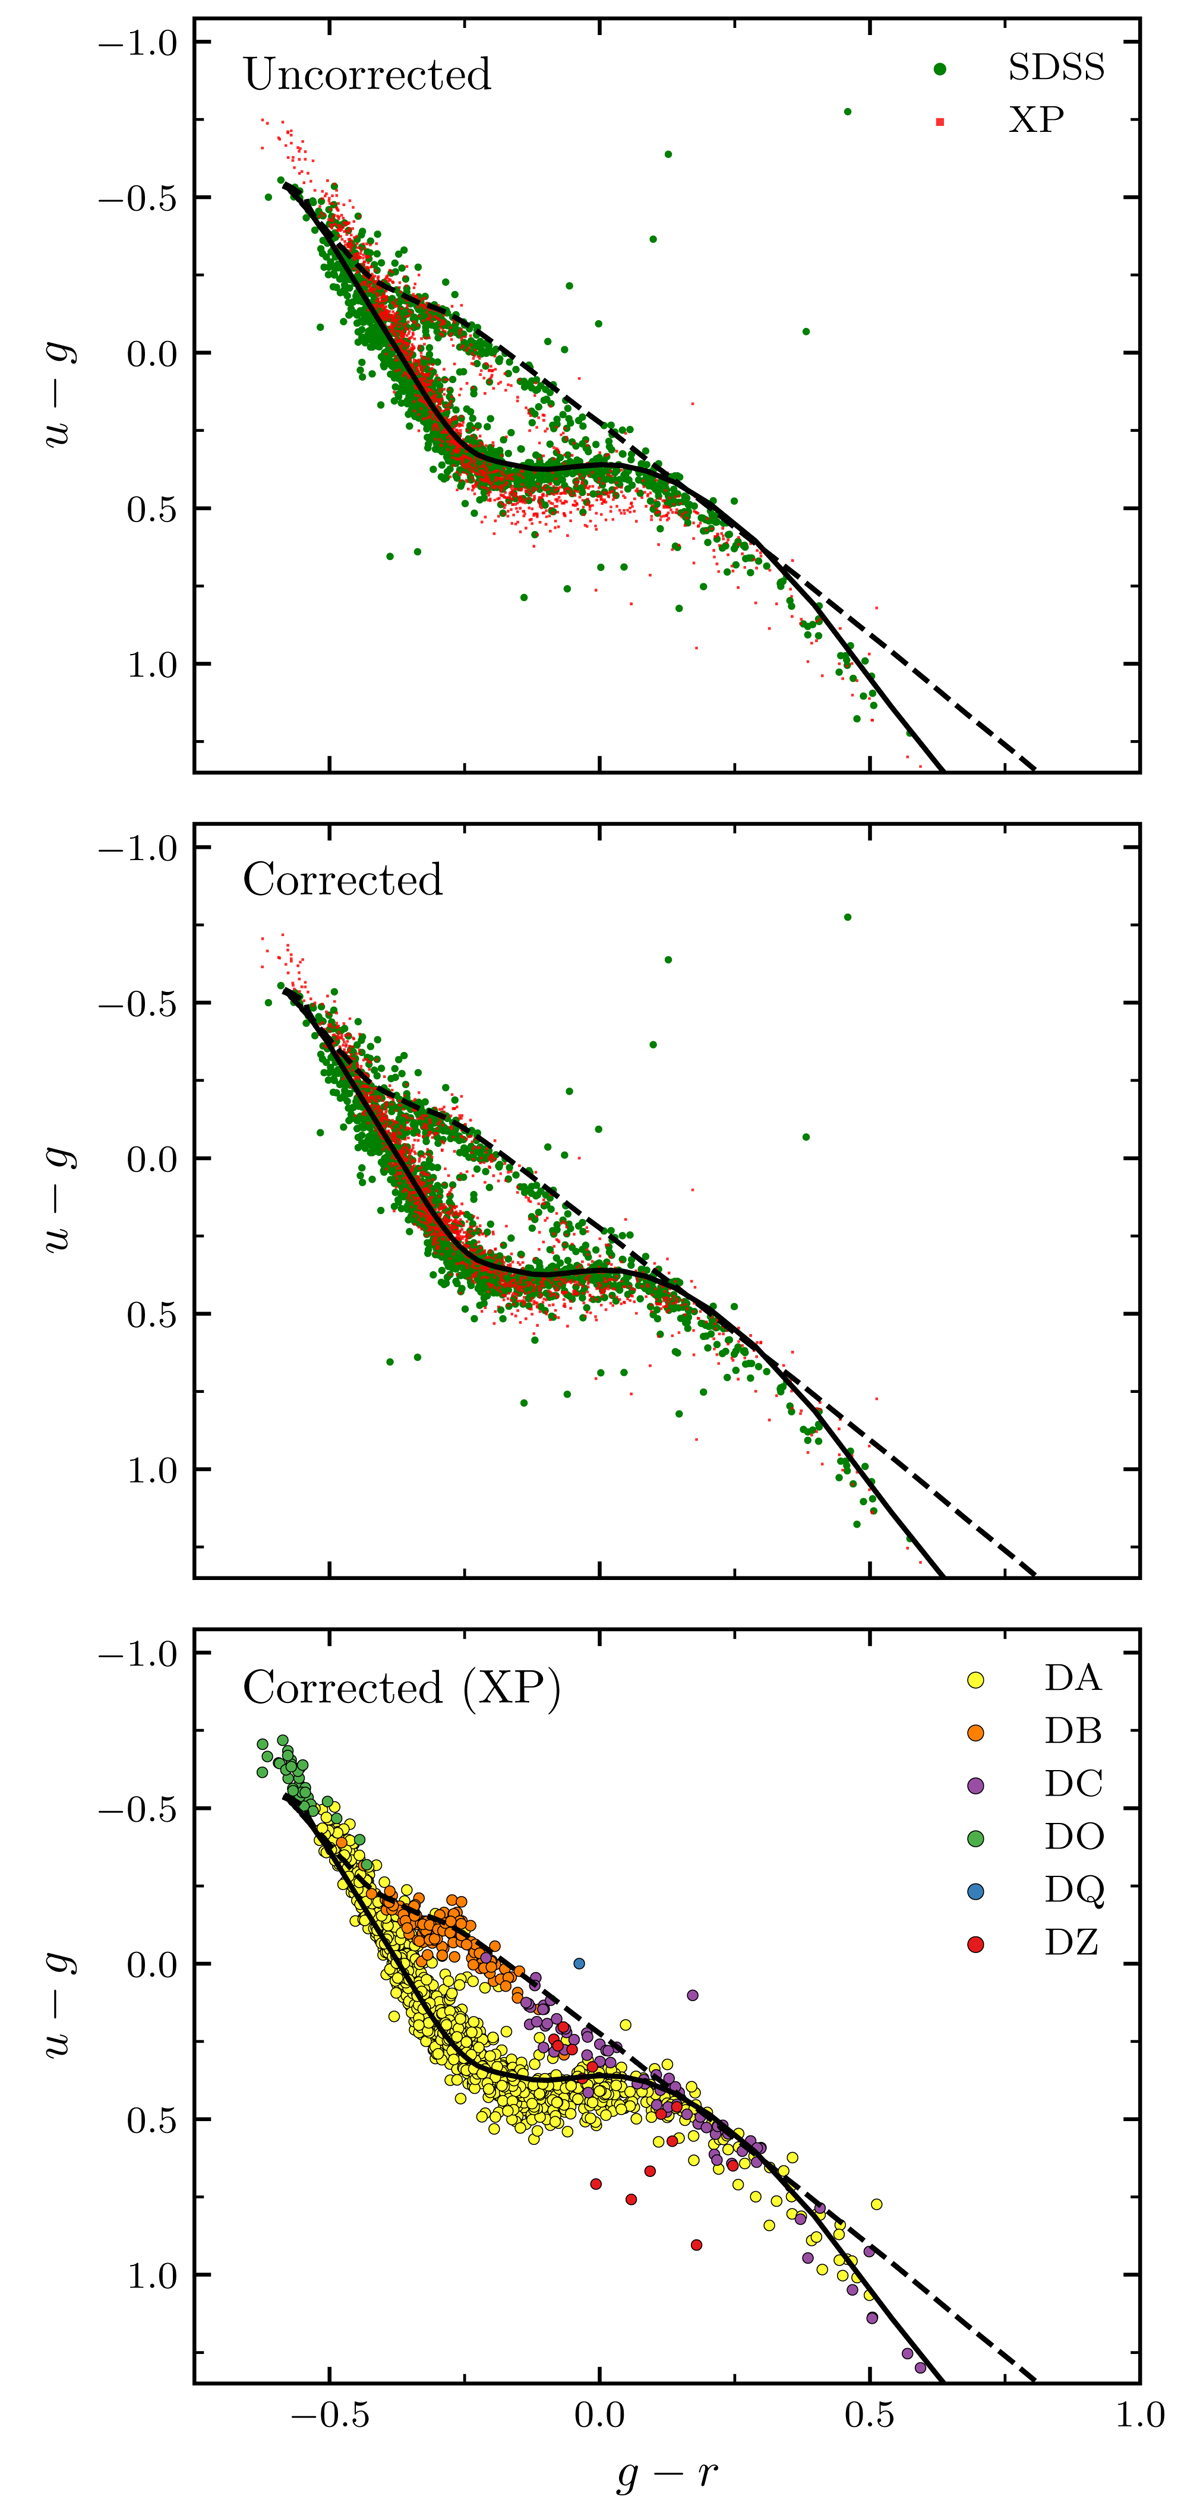
Download original image
Color–color diagrams of objects with both real and synthetic SDSS photometry. For clarity, only objects with G < 17 are shown. The top panel contains the two color–color distributions before the u band correction (see text), displaying a significant color-dependent shift between the two. The middle panel shows the distributions after the u band corrections have been applied to the synthetic photometry. The bottom panel shows the corrected synthetic photometry color–color diagram with points colored by their XP spectroscopic classification. On all three panels, the cooling tracks for pure hydrogen (full black line) and pure helium (dashed black line) are shown at a constant mass of 0.6 M⊙.
Current usage metrics show cumulative count of Article Views (full-text article views including HTML views, PDF and ePub downloads, according to the available data) and Abstracts Views on Vision4Press platform.
Data correspond to usage on the plateform after 2015. The current usage metrics is available 48-96 hours after online publication and is updated daily on week days.
Initial download of the metrics may take a while.