Fig. 10.
Download original image
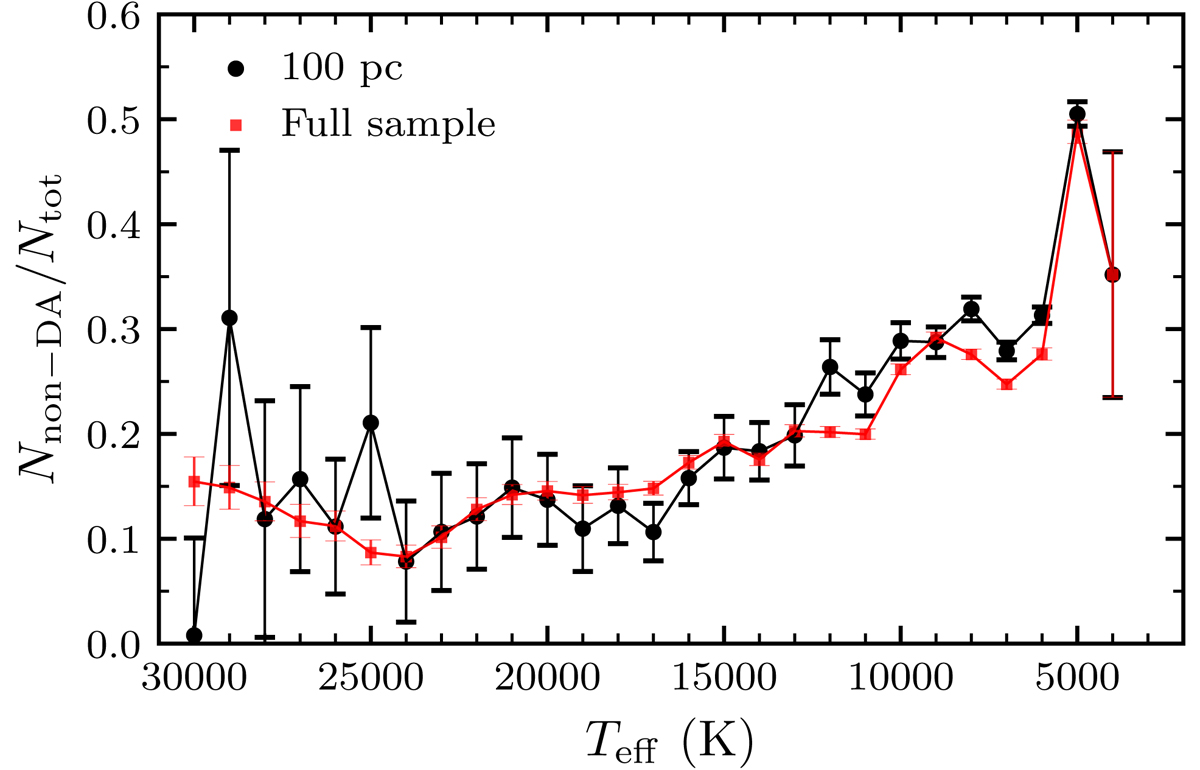
Spectral evolution curves of the GSPC-WD sample for objects within 100 pc of the Sun (black line) and the entire sample (red line). The non-DA ratio is calculated by summing the number of non-DA white dwarfs in each temperature bin, weighted according to their probability of being a DA, divided by the total number of stars within the bin.
Current usage metrics show cumulative count of Article Views (full-text article views including HTML views, PDF and ePub downloads, according to the available data) and Abstracts Views on Vision4Press platform.
Data correspond to usage on the plateform after 2015. The current usage metrics is available 48-96 hours after online publication and is updated daily on week days.
Initial download of the metrics may take a while.