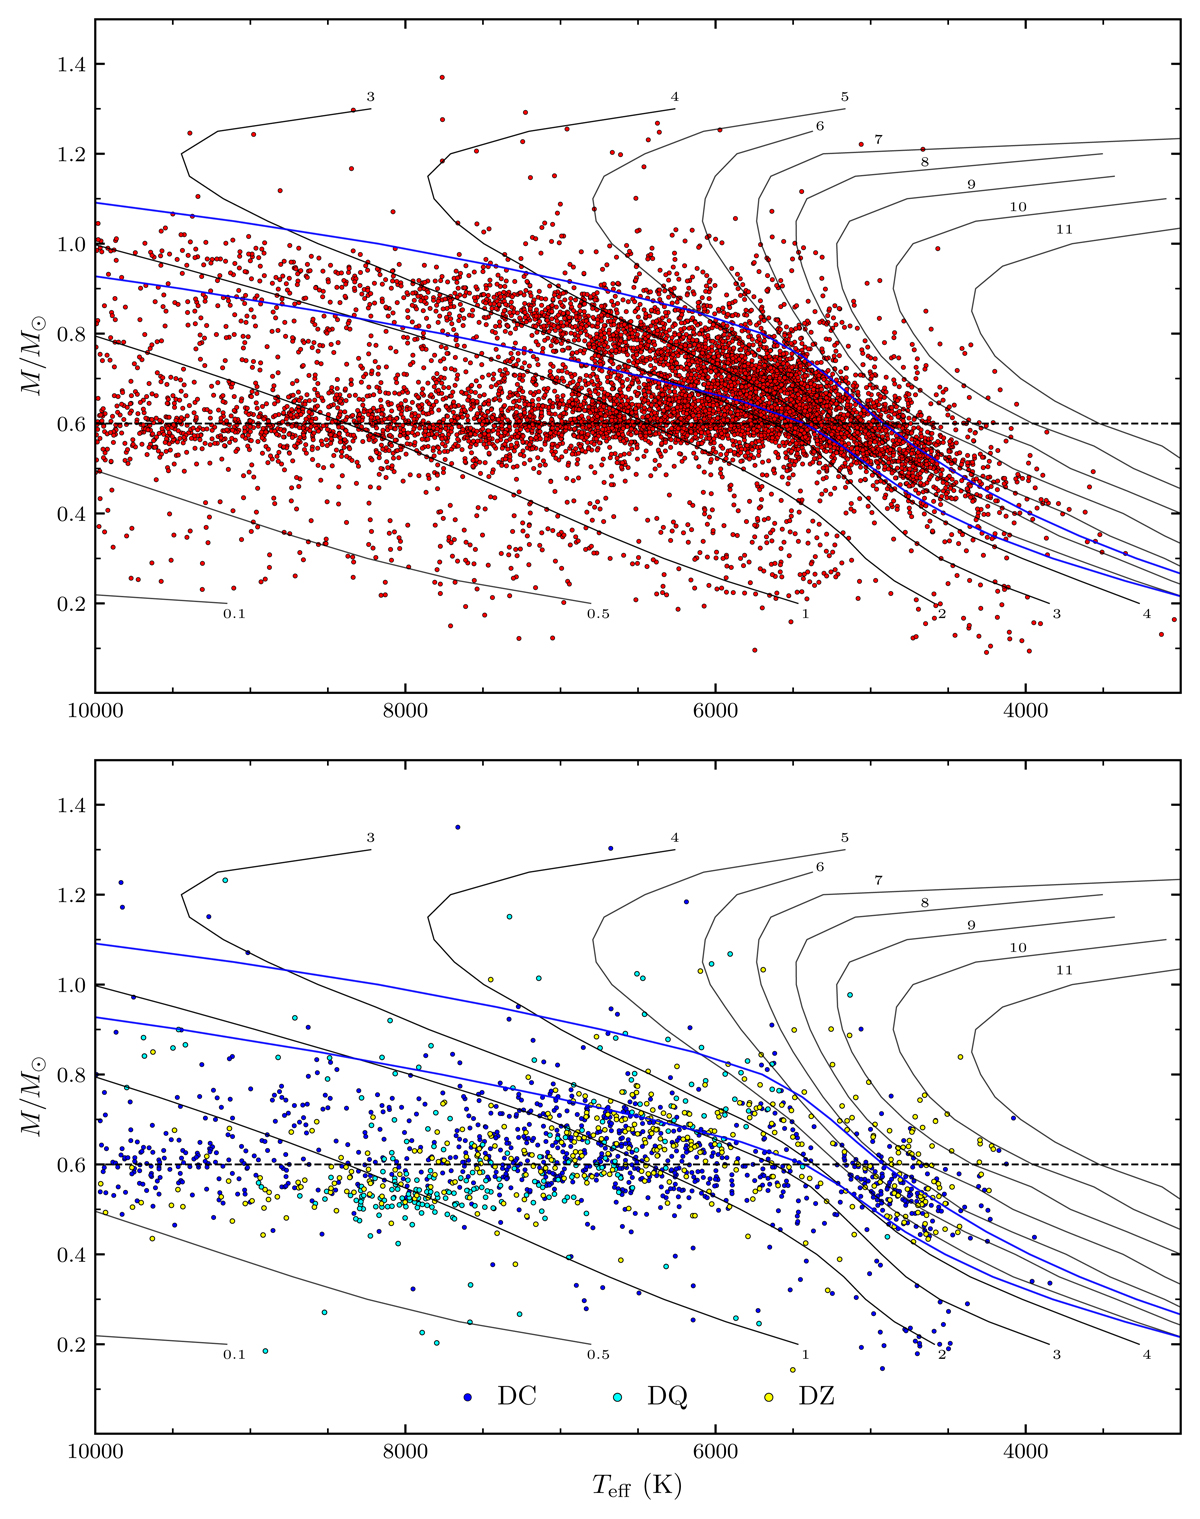
Fig. 9.
Download original image
Mass–temperature diagrams of the GSPC cool white dwarfs within 100 pc of the Sun. The top panel shows the diagram for DA stars, and the bottom panel shows the non-DA stars. Also shown as solid black curves are theoretical isochrones, labeled in units of Gyr, obtained from cooling sequences with C/O-core compositions, q(He) = 10−2, and q(H) = 10−4. The lower blue solid curve indicates the onset of crystallization at the centre of evolving models, and the upper one indicates the locations where 80% of the total mass has solidified. The dashed line indicates the fiducial mean mass of 0.6 M⊙.
Current usage metrics show cumulative count of Article Views (full-text article views including HTML views, PDF and ePub downloads, according to the available data) and Abstracts Views on Vision4Press platform.
Data correspond to usage on the plateform after 2015. The current usage metrics is available 48-96 hours after online publication and is updated daily on week days.
Initial download of the metrics may take a while.